
|
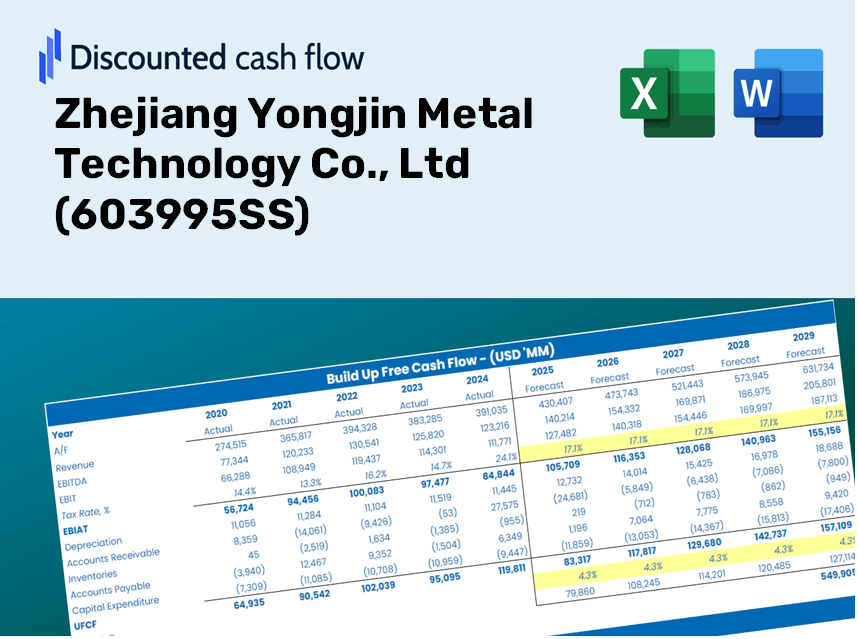
Zhejiang Yongjin Metal Technology Co., Ltd (603995.SS) DCF -Bewertung |
Fully Editable: Tailor To Your Needs In Excel Or Sheets
Professional Design: Trusted, Industry-Standard Templates
Investor-Approved Valuation Models
MAC/PC Compatible, Fully Unlocked
No Expertise Is Needed; Easy To Follow
Zhejiang Yongjin Metal Technology Co., Ltd (603995.SS) Bundle
Gewinnen Sie einen Einblick in Ihre Zhejiang Yongjin Metal Technology Co., Ltd (603995SS) Bewertungsanalyse mit unserem modernsten DCF-Taschenrechner! Ausgestattet mit aktuellen Daten für (603995S) können Sie mit dieser Excel-Vorlage Prognosen und Annahmen anpassen, um den inneren Wert von Zhejiang Yongjin Metal Technology Co., Ltd. genau zu bestimmen.
Discounted Cash Flow (DCF) - (USD MM)
| Year | AY1 2020 |
AY2 2021 |
AY3 2022 |
AY4 2023 |
AY5 2024 |
FY1 2025 |
FY2 2026 |
FY3 2027 |
FY4 2028 |
FY5 2029 |
|---|---|---|---|---|---|---|---|---|---|---|
| Revenue | 20,443.4 | 31,366.0 | 39,555.1 | 39,873.8 | 41,860.8 | 50,790.3 | 61,624.6 | 74,770.0 | 90,719.5 | 110,071.2 |
| Revenue Growth, % | 0 | 53.43 | 26.11 | 0.80564 | 4.98 | 21.33 | 21.33 | 21.33 | 21.33 | 21.33 |
| EBITDA | 826.1 | 1,193.1 | 1,185.9 | 1,324.3 | 1,856.9 | 1,889.4 | 2,292.5 | 2,781.5 | 3,374.8 | 4,094.7 |
| EBITDA, % | 4.04 | 3.8 | 3 | 3.32 | 4.44 | 3.72 | 3.72 | 3.72 | 3.72 | 3.72 |
| Depreciation | 187.8 | 268.3 | 364.4 | 441.7 | 532.0 | 515.4 | 625.3 | 758.7 | 920.6 | 1,117.0 |
| Depreciation, % | 0.91861 | 0.85534 | 0.92117 | 1.11 | 1.27 | 1.01 | 1.01 | 1.01 | 1.01 | 1.01 |
| EBIT | 638.3 | 924.8 | 821.6 | 882.6 | 1,324.9 | 1,374.0 | 1,667.1 | 2,022.7 | 2,454.2 | 2,977.7 |
| EBIT, % | 3.12 | 2.95 | 2.08 | 2.21 | 3.17 | 2.71 | 2.71 | 2.71 | 2.71 | 2.71 |
| Total Cash | 1,291.1 | 1,739.4 | 847.1 | 1,061.3 | 1,383.0 | 2,028.4 | 2,461.1 | 2,986.0 | 3,623.0 | 4,395.8 |
| Total Cash, percent | .0 | .0 | .0 | .0 | .0 | .0 | .0 | .0 | .0 | .0 |
| Account Receivables | 286.6 | 599.0 | 583.6 | 1,053.7 | 943.0 | 983.5 | 1,193.3 | 1,447.9 | 1,756.7 | 2,131.5 |
| Account Receivables, % | 1.4 | 1.91 | 1.48 | 2.64 | 2.25 | 1.94 | 1.94 | 1.94 | 1.94 | 1.94 |
| Inventories | 711.2 | 1,582.4 | 1,850.2 | 2,301.7 | 2,793.3 | 2,605.2 | 3,161.0 | 3,835.2 | 4,653.3 | 5,646.0 |
| Inventories, % | 3.48 | 5.05 | 4.68 | 5.77 | 6.67 | 5.13 | 5.13 | 5.13 | 5.13 | 5.13 |
| Accounts Payable | 569.6 | 1,474.2 | 1,637.2 | 1,057.3 | 2,381.0 | 2,028.0 | 2,460.6 | 2,985.5 | 3,622.4 | 4,395.1 |
| Accounts Payable, % | 2.79 | 4.7 | 4.14 | 2.65 | 5.69 | 3.99 | 3.99 | 3.99 | 3.99 | 3.99 |
| Capital Expenditure | -633.3 | -1,747.2 | -1,680.1 | -1,343.9 | -1,171.7 | -1,938.7 | -2,352.2 | -2,854.0 | -3,462.8 | -4,201.5 |
| Capital Expenditure, % | -3.1 | -5.57 | -4.25 | -3.37 | -2.8 | -3.82 | -3.82 | -3.82 | -3.82 | -3.82 |
| Tax Rate, % | 31.5 | 31.5 | 31.5 | 31.5 | 31.5 | 31.5 | 31.5 | 31.5 | 31.5 | 31.5 |
| EBITAT | 432.5 | 627.5 | 550.4 | 514.3 | 907.6 | 905.1 | 1,098.2 | 1,332.5 | 1,616.7 | 1,961.6 |
| Depreciation | ||||||||||
| Changes in Account Receivables | ||||||||||
| Changes in Inventories | ||||||||||
| Changes in Accounts Payable | ||||||||||
| Capital Expenditure | ||||||||||
| UFCF | -441.3 | -1,130.4 | -854.6 | -1,889.4 | 1,210.6 | -723.5 | -961.6 | -1,166.7 | -1,415.6 | -1,717.6 |
| WACC, % | 7.04 | 7.04 | 7.03 | 6.91 | 7.05 | 7.01 | 7.01 | 7.01 | 7.01 | 7.01 |
| PV UFCF | ||||||||||
| SUM PV UFCF | -4,771.0 | |||||||||
| Long Term Growth Rate, % | 2.00 | |||||||||
| Free cash flow (T + 1) | -1,752 | |||||||||
| Terminal Value | -34,939 | |||||||||
| Present Terminal Value | -24,894 | |||||||||
| Enterprise Value | -29,665 | |||||||||
| Net Debt | 1,988 | |||||||||
| Equity Value | -31,653 | |||||||||
| Diluted Shares Outstanding, MM | 404 | |||||||||
| Equity Value Per Share | -78.29 |
What You Will Receive
- Authentic Zhejiang Yongjin Financials: Access to comprehensive historical and projected data for precise valuation.
- Customizable Inputs: Adjust parameters such as WACC, tax rates, revenue growth, and capital expenditures.
- Dynamic Calculations: Intrinsic value and NPV are computed automatically.
- Scenario Analysis: Explore various scenarios to assess the future performance of Zhejiang Yongjin Metal Technology Co., Ltd (603995SS).
- User-Friendly Design: Designed for industry professionals while remaining approachable for newcomers.
Key Features
- Pre-Loaded Data: Comprehensive financial statements and forecasts for Zhejiang Yongjin Metal Technology Co., Ltd (603995SS).
- Fully Customizable Inputs: Adjust WACC, tax rates, revenue growth, and EBITDA margins to suit your analysis.
- Real-Time Results: View the intrinsic value of Zhejiang Yongjin Metal Technology Co., Ltd (603995SS) recalculating instantly.
- Dynamic Visualizations: Interactive dashboard charts present valuation results and essential metrics clearly.
- Designed for Precision: A reliable tool tailored for analysts, investors, and finance professionals.
How It Works
- Step 1: Download the prebuilt Excel template featuring Zhejiang Yongjin Metal Technology Co., Ltd's [603995SS] data.
- Step 2: Navigate through the pre-filled sheets to familiarize yourself with the essential metrics.
- Step 3: Modify forecasts and assumptions in the editable yellow cells (WACC, growth, margins).
- Step 4: Instantly access updated results, including the intrinsic value of Zhejiang Yongjin Metal Technology Co., Ltd [603995SS].
- Step 5: Utilize the outputs to make well-informed investment decisions or to prepare reports.
Why Use This Calculator for Zhejiang Yongjin Metal Technology Co., Ltd (603995SS)?
- All-in-One Solution: Features DCF, WACC, and financial ratio analyses for a comprehensive evaluation.
- Adjustable Parameters: Modify the yellow-highlighted cells to explore different financial scenarios.
- In-Depth Analysis: Automatically computes the intrinsic value and Net Present Value for Zhejiang Yongjin Metal Technology Co., Ltd.
- Ready-to-Use Data: Includes historical and projected data for precise starting points.
- High-Quality Standards: Perfect for financial analysts, investors, and business consultants working with Zhejiang Yongjin Metal Technology Co., Ltd.
Who Can Benefit from This Product?
- Institutional Investors: Develop comprehensive and accurate valuation models for analyzing [603995SS].
- Corporate Finance Departments: Evaluate valuation scenarios to shape strategic decisions.
- Financial Consultants and Advisors: Deliver precise valuation insights related to Zhejiang Yongjin Metal Technology Co., Ltd ([603995SS]) for clients.
- Students and Educators: Leverage real-world data for practical applications in financial modeling and teaching.
- Industry Analysts: Gain insights into the market valuation of metal technology firms like Zhejiang Yongjin ([603995SS]).
Contents of the Template
- Pre-Filled DCF Model: Zhejiang Yongjin Metal Technology Co., Ltd’s financial data preloaded for immediate application.
- WACC Calculator: Comprehensive calculations for Weighted Average Cost of Capital.
- Financial Ratios: Analyze Zhejiang Yongjin Metal's profitability, leverage, and operational efficiency.
- Editable Inputs: Modify assumptions such as growth rates, profit margins, and capital expenditures to suit your scenarios.
- Financial Statements: Access to annual and quarterly reports for in-depth analysis.
- Interactive Dashboard: Effortlessly visualize key valuation metrics and outcomes.
Disclaimer
All information, articles, and product details provided on this website are for general informational and educational purposes only. We do not claim any ownership over, nor do we intend to infringe upon, any trademarks, copyrights, logos, brand names, or other intellectual property mentioned or depicted on this site. Such intellectual property remains the property of its respective owners, and any references here are made solely for identification or informational purposes, without implying any affiliation, endorsement, or partnership.
We make no representations or warranties, express or implied, regarding the accuracy, completeness, or suitability of any content or products presented. Nothing on this website should be construed as legal, tax, investment, financial, medical, or other professional advice. In addition, no part of this site—including articles or product references—constitutes a solicitation, recommendation, endorsement, advertisement, or offer to buy or sell any securities, franchises, or other financial instruments, particularly in jurisdictions where such activity would be unlawful.
All content is of a general nature and may not address the specific circumstances of any individual or entity. It is not a substitute for professional advice or services. Any actions you take based on the information provided here are strictly at your own risk. You accept full responsibility for any decisions or outcomes arising from your use of this website and agree to release us from any liability in connection with your use of, or reliance upon, the content or products found herein.