
|
Poly Property Services Co., Ltd. (6049.hk) DCF -Bewertung |
Fully Editable: Tailor To Your Needs In Excel Or Sheets
Professional Design: Trusted, Industry-Standard Templates
Investor-Approved Valuation Models
MAC/PC Compatible, Fully Unlocked
No Expertise Is Needed; Easy To Follow
Poly Property Services Co., Ltd. (6049.HK) Bundle
Verbessern Sie Ihre Investitionsauswahl mit dem DCF -Taschenrechner (6049HK)! Erforschen Sie Real Poly Property Services Co., Ltd. Financials, passen Sie Wachstumsvorhersagen und -kosten an und beobachten Sie sofort, wie sich diese Modifikationen auf den inneren Wert von (6049HK) auswirken.
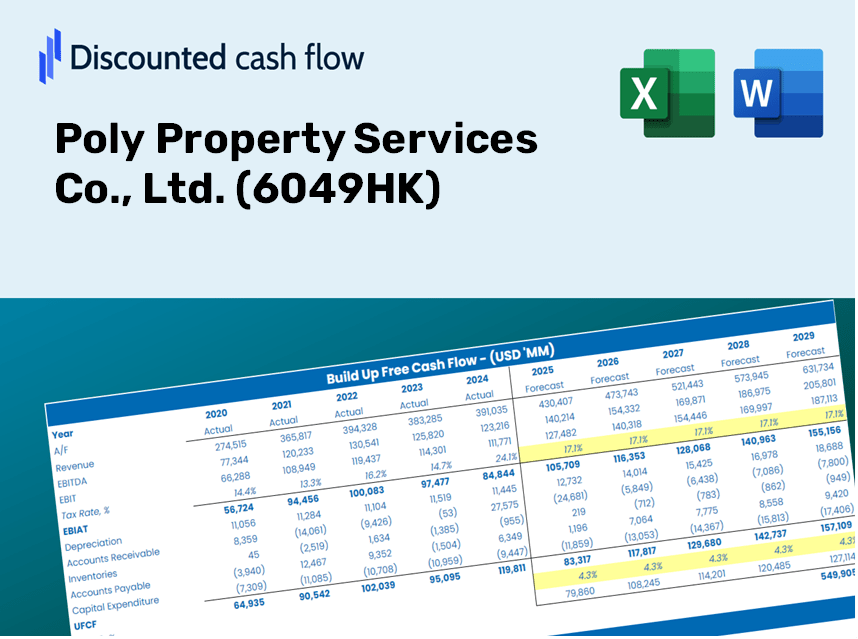
Discounted Cash Flow (DCF) - (USD MM)
| Year | AY1 2020 |
AY2 2021 |
AY3 2022 |
AY4 2023 |
AY5 2024 |
FY1 2025 |
FY2 2026 |
FY3 2027 |
FY4 2028 |
FY5 2029 |
|---|---|---|---|---|---|---|---|---|---|---|
| Revenue | 8,790.5 | 11,793.2 | 14,969.6 | 16,473.6 | 17,874.1 | 18,704.5 | 19,573.4 | 20,482.7 | 21,434.2 | 22,429.9 |
| Revenue Growth, % | 0 | 34.16 | 26.93 | 10.05 | 8.5 | 4.65 | 4.65 | 4.65 | 4.65 | 4.65 |
| EBITDA | 1,141.4 | 1,635.3 | 2,077.8 | 2,443.2 | 2,107.0 | 2,519.5 | 2,636.6 | 2,759.0 | 2,887.2 | 3,021.3 |
| EBITDA, % | 12.98 | 13.87 | 13.88 | 14.83 | 11.79 | 13.47 | 13.47 | 13.47 | 13.47 | 13.47 |
| Depreciation | 113.3 | 352.4 | 417.6 | 424.4 | 83.1 | 378.1 | 395.7 | 414.1 | 433.3 | 453.4 |
| Depreciation, % | 1.29 | 2.99 | 2.79 | 2.58 | 0.4652 | 2.02 | 2.02 | 2.02 | 2.02 | 2.02 |
| EBIT | 1,028.1 | 1,282.9 | 1,660.3 | 2,018.8 | 2,023.8 | 2,141.4 | 2,240.9 | 2,345.0 | 2,453.9 | 2,567.9 |
| EBIT, % | 11.7 | 10.88 | 11.09 | 12.25 | 11.32 | 11.45 | 11.45 | 11.45 | 11.45 | 11.45 |
| Total Cash | 8,146.2 | 8,411.4 | 9,965.8 | 12,225.2 | 10,817.8 | 13,665.5 | 14,300.4 | 14,964.7 | 15,659.9 | 16,387.4 |
| Total Cash, percent | .0 | .0 | .0 | .0 | .0 | .0 | .0 | .0 | .0 | .0 |
| Account Receivables | 971.3 | 2,460.3 | 3,430.2 | 2,560.0 | 4,061.8 | 3,482.4 | 3,644.2 | 3,813.5 | 3,990.6 | 4,176.0 |
| Account Receivables, % | 11.05 | 20.86 | 22.91 | 15.54 | 22.72 | 18.62 | 18.62 | 18.62 | 18.62 | 18.62 |
| Inventories | 55.4 | 55.3 | 44.2 | 34.3 | 34.6 | 67.2 | 70.3 | 73.6 | 77.0 | 80.6 |
| Inventories, % | 0.63002 | 0.4689 | 0.29524 | 0.20824 | 0.19358 | 0.3592 | 0.3592 | 0.3592 | 0.3592 | 0.3592 |
| Accounts Payable | 434.3 | 879.0 | 1,722.5 | 2,197.4 | 3,012.3 | 2,023.5 | 2,117.5 | 2,215.9 | 2,318.8 | 2,426.6 |
| Accounts Payable, % | 4.94 | 7.45 | 11.51 | 13.34 | 16.85 | 10.82 | 10.82 | 10.82 | 10.82 | 10.82 |
| Capital Expenditure | -67.5 | -85.6 | -81.0 | -83.8 | -991.5 | -302.7 | -316.7 | -331.4 | -346.8 | -362.9 |
| Capital Expenditure, % | -0.76754 | -0.72602 | -0.5414 | -0.50852 | -5.55 | -1.62 | -1.62 | -1.62 | -1.62 | -1.62 |
| Tax Rate, % | 24.98 | 24.98 | 24.98 | 24.98 | 24.98 | 24.98 | 24.98 | 24.98 | 24.98 | 24.98 |
| EBITAT | 740.4 | 933.4 | 1,221.0 | 1,513.4 | 1,518.3 | 1,577.3 | 1,650.6 | 1,727.3 | 1,807.5 | 1,891.5 |
| Depreciation | ||||||||||
| Changes in Account Receivables | ||||||||||
| Changes in Inventories | ||||||||||
| Changes in Accounts Payable | ||||||||||
| Capital Expenditure | ||||||||||
| UFCF | 193.9 | 155.9 | 1,442.2 | 3,209.0 | -77.3 | 1,210.9 | 1,658.7 | 1,735.7 | 1,816.4 | 1,900.7 |
| WACC, % | 7.82 | 7.82 | 7.82 | 7.82 | 7.82 | 7.82 | 7.82 | 7.82 | 7.82 | 7.82 |
| PV UFCF | ||||||||||
| SUM PV UFCF | 6,582.6 | |||||||||
| Long Term Growth Rate, % | 2.00 | |||||||||
| Free cash flow (T + 1) | 1,939 | |||||||||
| Terminal Value | 33,296 | |||||||||
| Present Terminal Value | 22,847 | |||||||||
| Enterprise Value | 29,430 | |||||||||
| Net Debt | -10,702 | |||||||||
| Equity Value | 40,132 | |||||||||
| Diluted Shares Outstanding, MM | 549 | |||||||||
| Equity Value Per Share | 73.03 |
What You'll Receive
- Pre-Loaded Financial Model: Utilize Poly Property Services Co., Ltd.’s actual data for accurate DCF valuation.
- Comprehensive Forecast Control: Modify revenue growth, profit margins, WACC, and other critical drivers.
- Real-Time Calculations: Automatic updates ensure results reflect your adjustments instantly.
- Professional-Grade Template: A polished Excel file crafted for high-quality valuation.
- Flexible and Reusable: Designed for adaptability, making it easy to generate thorough forecasts repeatedly.
Core Features
- Authentic Financial Data: Gain access to reliable, pre-loaded historical figures and future forecasts for Poly Property Services Co., Ltd. (6049HK).
- Adjustable Forecast Parameters: Modify highlighted cells to set your assumptions for WACC, growth rates, and profit margins.
- Real-Time Calculations: Automatic recalculations for DCF, Net Present Value (NPV), and cash flow assessments.
- User-Friendly Dashboard: Clear charts and summaries to help you visualize your valuation results effectively.
- Designed for All Levels: An intuitive layout tailored for investors, CFOs, and consultants, whether experienced or new to the field.
How It Works
- Download the Template: Gain immediate access to the Excel-based Poly Property Services DCF Calculator.
- Input Your Assumptions: Modify the yellow-highlighted fields to set growth rates, WACC, margins, and other parameters.
- Instant Calculations: The model will automatically refresh to reflect the intrinsic value of Poly Property Services (6049HK).
- Test Scenarios: Experiment with various assumptions to assess potential changes in valuation.
- Analyze and Decide: Utilize the outcomes to inform your investment or financial assessments.
Why Opt for Our Valuation Tool?
- Precision: Leveraging authentic financial data from Poly Property Services Co., Ltd. ensures precision in every calculation.
- Adaptability: Crafted to allow users to effortlessly adjust and explore various scenarios.
- Efficiency: Eliminate the need to create a valuation model from the ground up.
- Executive-Quality: Designed with the insight and rigor expected at the CFO level.
- Intuitive: Simple and accessible for users, regardless of their financial modeling skills.
Who Can Benefit from Our Services?
- Property Investors: Gain valuable insights for making informed decisions about investing in real estate with Poly Property Services Co., Ltd. (6049HK).
- Market Analysts: Enhance your analysis with comprehensive data and tools tailored to property valuation.
- Real Estate Consultants: Provide your clients with precise and timely property insights with the support of our expert resources.
- Business Owners: Learn how the valuation of established companies like Poly Property Services Co., Ltd. (6049HK) can influence your own business strategies.
- Real Estate Students: Acquire practical knowledge of property valuation through hands-on experience and real-life case studies.
Features of the Template
- Preloaded Poly Property Data: Historical and projected financial metrics, including revenue, EBIT, and capital expenditures.
- DCF and WACC Models: Professional sheets for calculating intrinsic value and Weighted Average Cost of Capital.
- Editable Inputs: Yellow-highlighted cells for modifying revenue growth, tax rates, and discount rates.
- Financial Statements: Detailed annual and quarterly financial reports for in-depth analysis.
- Key Ratios: Profitability, leverage, and efficiency ratios for performance assessment.
- Dashboard and Charts: Visual representations of valuation results and assumptions.
Disclaimer
All information, articles, and product details provided on this website are for general informational and educational purposes only. We do not claim any ownership over, nor do we intend to infringe upon, any trademarks, copyrights, logos, brand names, or other intellectual property mentioned or depicted on this site. Such intellectual property remains the property of its respective owners, and any references here are made solely for identification or informational purposes, without implying any affiliation, endorsement, or partnership.
We make no representations or warranties, express or implied, regarding the accuracy, completeness, or suitability of any content or products presented. Nothing on this website should be construed as legal, tax, investment, financial, medical, or other professional advice. In addition, no part of this site—including articles or product references—constitutes a solicitation, recommendation, endorsement, advertisement, or offer to buy or sell any securities, franchises, or other financial instruments, particularly in jurisdictions where such activity would be unlawful.
All content is of a general nature and may not address the specific circumstances of any individual or entity. It is not a substitute for professional advice or services. Any actions you take based on the information provided here are strictly at your own risk. You accept full responsibility for any decisions or outcomes arising from your use of this website and agree to release us from any liability in connection with your use of, or reliance upon, the content or products found herein.