
|
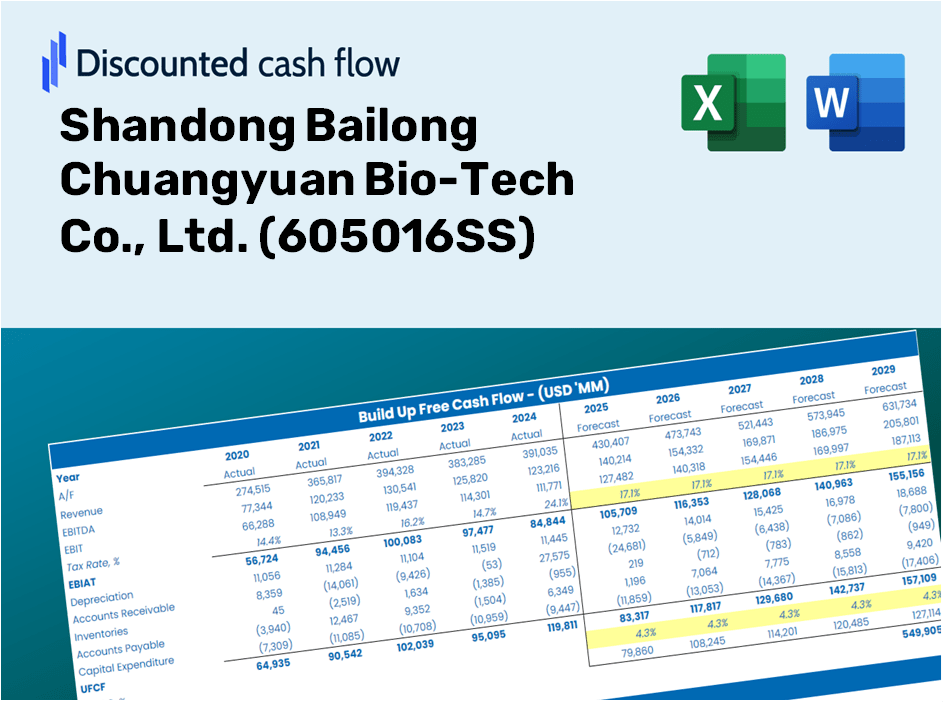
Shandong Bailong Chuangyuan Bio-Tech Co., Ltd. (605016.SS) DCF-Bewertung |
Fully Editable: Tailor To Your Needs In Excel Or Sheets
Professional Design: Trusted, Industry-Standard Templates
Investor-Approved Valuation Models
MAC/PC Compatible, Fully Unlocked
No Expertise Is Needed; Easy To Follow
Shandong Bailong Chuangyuan Bio-Tech Co., Ltd. (605016.SS) Bundle
Entdecken Sie das wahre Potenzial von Shandong Bailong Chuangyuan Bio-Tech Co., Ltd. (605016SS) mit unserem fortschrittlichen DCF-Taschenrechner! Passen Sie kritische Annahmen an, untersuchen Sie verschiedene Szenarien und beurteilen Sie, wie unterschiedliche Faktoren die Bewertung von Shandong Bailong Chuangyuan Bio-Tech Co., Ltd. (605016Ss)-beeinflussen-alles innerhalb einer umfassenden Excel-Vorlage.
Discounted Cash Flow (DCF) - (USD MM)
| Year | AY1 2020 |
AY2 2021 |
AY3 2022 |
AY4 2023 |
AY5 2024 |
FY1 2025 |
FY2 2026 |
FY3 2027 |
FY4 2028 |
FY5 2029 |
|---|---|---|---|---|---|---|---|---|---|---|
| Revenue | 499.6 | 653.4 | 721.9 | 868.3 | 1,151.7 | 1,422.8 | 1,757.8 | 2,171.6 | 2,682.9 | 3,314.5 |
| Revenue Growth, % | 0 | 30.77 | 10.49 | 20.28 | 32.64 | 23.54 | 23.54 | 23.54 | 23.54 | 23.54 |
| EBITDA | 150.4 | 156.5 | 192.4 | 238.4 | 334.2 | 390.4 | 482.3 | 595.8 | 736.1 | 909.4 |
| EBITDA, % | 30.1 | 23.95 | 26.65 | 27.46 | 29.02 | 27.44 | 27.44 | 27.44 | 27.44 | 27.44 |
| Depreciation | 42.9 | 46.5 | 46.7 | 44.9 | 75.4 | 96.5 | 119.2 | 147.3 | 182.0 | 224.8 |
| Depreciation, % | 8.6 | 7.12 | 6.48 | 5.17 | 6.55 | 6.78 | 6.78 | 6.78 | 6.78 | 6.78 |
| EBIT | 107.4 | 110.0 | 145.7 | 193.5 | 258.8 | 293.9 | 363.1 | 448.5 | 554.1 | 684.6 |
| EBIT, % | 21.5 | 16.83 | 20.18 | 22.28 | 22.48 | 20.65 | 20.65 | 20.65 | 20.65 | 20.65 |
| Total Cash | 141.4 | 553.6 | 521.7 | 428.6 | 439.1 | 776.2 | 959.0 | 1,184.7 | 1,463.7 | 1,808.3 |
| Total Cash, percent | .0 | .0 | .0 | .0 | .0 | .0 | .0 | .0 | .0 | .0 |
| Account Receivables | 127.0 | 145.1 | 154.8 | 174.3 | 240.9 | 313.2 | 386.9 | 478.0 | 590.6 | 729.6 |
| Account Receivables, % | 25.42 | 22.2 | 21.45 | 20.07 | 20.92 | 22.01 | 22.01 | 22.01 | 22.01 | 22.01 |
| Inventories | 90.0 | 121.8 | 167.7 | 152.1 | 186.8 | 266.4 | 329.2 | 406.7 | 502.4 | 620.7 |
| Inventories, % | 18.02 | 18.65 | 23.23 | 17.51 | 16.22 | 18.73 | 18.73 | 18.73 | 18.73 | 18.73 |
| Accounts Payable | 52.4 | 46.1 | 93.3 | 171.0 | 242.8 | 202.7 | 250.4 | 309.4 | 382.2 | 472.2 |
| Accounts Payable, % | 10.48 | 7.05 | 12.93 | 19.69 | 21.08 | 14.25 | 14.25 | 14.25 | 14.25 | 14.25 |
| Capital Expenditure | -58.7 | -55.8 | -175.6 | -312.0 | -281.8 | -298.8 | -369.2 | -456.1 | -563.5 | -696.1 |
| Capital Expenditure, % | -11.74 | -8.54 | -24.32 | -35.93 | -24.47 | -21 | -21 | -21 | -21 | -21 |
| Tax Rate, % | 13.92 | 13.92 | 13.92 | 13.92 | 13.92 | 13.92 | 13.92 | 13.92 | 13.92 | 13.92 |
| EBITAT | 93.3 | 96.7 | 126.9 | 168.5 | 222.8 | 255.7 | 315.9 | 390.3 | 482.2 | 595.7 |
| Depreciation | ||||||||||
| Changes in Account Receivables | ||||||||||
| Changes in Inventories | ||||||||||
| Changes in Accounts Payable | ||||||||||
| Capital Expenditure | ||||||||||
| UFCF | -87.1 | 31.3 | -10.3 | -24.7 | -13.2 | -138.6 | -22.8 | -28.1 | -34.8 | -43.0 |
| WACC, % | 6.09 | 6.09 | 6.09 | 6.09 | 6.09 | 6.09 | 6.09 | 6.09 | 6.09 | 6.09 |
| PV UFCF | ||||||||||
| SUM PV UFCF | -233.9 | |||||||||
| Long Term Growth Rate, % | 3.50 | |||||||||
| Free cash flow (T + 1) | -44 | |||||||||
| Terminal Value | -1,716 | |||||||||
| Present Terminal Value | -1,277 | |||||||||
| Enterprise Value | -1,511 | |||||||||
| Net Debt | -276 | |||||||||
| Equity Value | -1,235 | |||||||||
| Diluted Shares Outstanding, MM | 323 | |||||||||
| Equity Value Per Share | -3.82 |
Benefits of Using Our Model
- Adjustable Forecast Parameters: Effortlessly modify key assumptions (growth %, profit margins, WACC) to explore various scenarios.
- Comprehensive Data Inputs: Shandong Bailong Chuangyuan Bio-Tech Co., Ltd.'s financial information pre-loaded for a seamless analysis experience.
- Instant DCF Calculations: The template automatically computes Net Present Value (NPV) and intrinsic value.
- Professional and Tailored: A sleek Excel model designed to fit your valuation requirements.
- Designed for Analysts and Investors: Perfect for assessing projections, confirming strategies, and optimizing efficiency.
Key Features
- Customizable Forecast Inputs: Adjust essential parameters such as revenue growth, EBITDA %, and investment expenditures.
- Instant DCF Valuation: Quickly computes intrinsic value, NPV, and other financial metrics.
- High-Precision Accuracy: Leverages Shandong Bailong Chuangyuan's actual financial data for realistic valuation results.
- Effortless Scenario Analysis: Easily explore various assumptions and evaluate their outcomes side by side.
- Efficiency Boosting Tool: Remove the complexity of building intricate valuation models from the ground up.
How It Works
- Download: Get the pre-configured Excel file containing financial data for Shandong Bailong Chuangyuan Bio-Tech Co., Ltd. (605016SS).
- Customize: Modify forecasts such as revenue growth, EBITDA %, and WACC to fit your analysis.
- Update Automatically: Watch as intrinsic value and NPV calculations refresh in real-time.
- Test Scenarios: Generate various projections and instantly compare the results.
- Make Decisions: Use the valuation insights to inform your investment strategy for Shandong Bailong Chuangyuan Bio-Tech Co., Ltd. (605016SS).
Why Choose Shandong Bailong Chuangyuan Bio-Tech Co., Ltd. (605016SS)?
- Reliability: Backed by authentic financial data for trustworthy insights.
- Versatility: Tailored for users to experiment with and adjust variables easily.
- Efficiency: Eliminate the need to create complex models from the ground up.
- Expert-Level Quality: Crafted with the accuracy and functionality expected by industry leaders.
- Intuitive Interface: Simple navigation, suitable for users of all skill levels in financial analysis.
Who Should Use This Product?
- Investors: Assess the valuation of Shandong Bailong Chuangyuan Bio-Tech Co., Ltd. (605016SS) prior to making investment decisions.
- CFOs and Financial Analysts: Optimize valuation methodologies and evaluate financial forecasts.
- Startup Founders: Gain insights into the valuation processes of leading biotech firms like Shandong Bailong Chuangyuan.
- Consultants: Provide comprehensive valuation reports to clients in the biotech sector.
- Students and Educators: Utilize authentic data to enhance learning and practice of valuation methods.
What the Template Includes
- Pre-Filled DCF Model: Shandong Bailong Chuangyuan Bio-Tech Co., Ltd.’s (605016SS) financial data ready for instant application.
- WACC Calculator: Comprehensive calculations for Weighted Average Cost of Capital tailored to the company.
- Financial Ratios: Assess Shandong Bailong Chuangyuan's profitability, leverage, and operational efficiency.
- Editable Inputs: Modify assumptions like growth rates, profit margins, and CAPEX to suit your analysis needs.
- Financial Statements: Annual and quarterly reports available for in-depth evaluation.
- Interactive Dashboard: Seamlessly visualize critical valuation metrics and outcomes.
Disclaimer
All information, articles, and product details provided on this website are for general informational and educational purposes only. We do not claim any ownership over, nor do we intend to infringe upon, any trademarks, copyrights, logos, brand names, or other intellectual property mentioned or depicted on this site. Such intellectual property remains the property of its respective owners, and any references here are made solely for identification or informational purposes, without implying any affiliation, endorsement, or partnership.
We make no representations or warranties, express or implied, regarding the accuracy, completeness, or suitability of any content or products presented. Nothing on this website should be construed as legal, tax, investment, financial, medical, or other professional advice. In addition, no part of this site—including articles or product references—constitutes a solicitation, recommendation, endorsement, advertisement, or offer to buy or sell any securities, franchises, or other financial instruments, particularly in jurisdictions where such activity would be unlawful.
All content is of a general nature and may not address the specific circumstances of any individual or entity. It is not a substitute for professional advice or services. Any actions you take based on the information provided here are strictly at your own risk. You accept full responsibility for any decisions or outcomes arising from your use of this website and agree to release us from any liability in connection with your use of, or reliance upon, the content or products found herein.