
|
Xianheng International Science & Technology Co., Ltd. (605056.SS) DCF -Bewertung |
Fully Editable: Tailor To Your Needs In Excel Or Sheets
Professional Design: Trusted, Industry-Standard Templates
Investor-Approved Valuation Models
MAC/PC Compatible, Fully Unlocked
No Expertise Is Needed; Easy To Follow
Xianheng International Science&Technology Co., Ltd. (605056.SS) Bundle
Egal, ob Sie ein Investor oder Analyst sind, dieser DCF -Taschenrechner (605056S) ist Ihr ultimatives Werkzeug für eine genaue Bewertung. Vorausgeladen mit Xianheng International Science & TECHNOLOGY Co., Ltd. Real Data, Sie können Prognosen anpassen und die Effekte in Echtzeit beobachten.
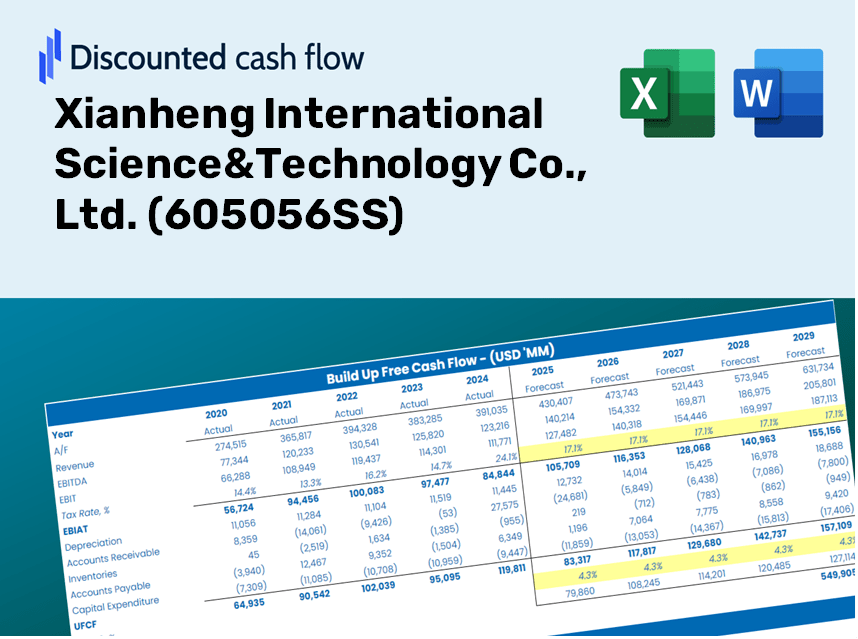
Discounted Cash Flow (DCF) - (USD MM)
| Year | AY1 2020 |
AY2 2021 |
AY3 2022 |
AY4 2023 |
AY5 2024 |
FY1 2025 |
FY2 2026 |
FY3 2027 |
FY4 2028 |
FY5 2029 |
|---|---|---|---|---|---|---|---|---|---|---|
| Revenue | 1,990.9 | 1,992.5 | 2,123.7 | 2,927.9 | 3,605.6 | 4,215.7 | 4,929.0 | 5,763.0 | 6,738.1 | 7,878.2 |
| Revenue Growth, % | 0 | 0.08285694 | 6.59 | 37.87 | 23.15 | 16.92 | 16.92 | 16.92 | 16.92 | 16.92 |
| EBITDA | 338.3 | 308.1 | 323.2 | 191.2 | 352.7 | 539.5 | 630.8 | 737.5 | 862.3 | 1,008.2 |
| EBITDA, % | 16.99 | 15.46 | 15.22 | 6.53 | 9.78 | 12.8 | 12.8 | 12.8 | 12.8 | 12.8 |
| Depreciation | 20.2 | 33.4 | 33.8 | 43.0 | 36.8 | 57.1 | 66.8 | 78.1 | 91.3 | 106.7 |
| Depreciation, % | 1.02 | 1.68 | 1.59 | 1.47 | 1.02 | 1.35 | 1.35 | 1.35 | 1.35 | 1.35 |
| EBIT | 318.1 | 274.7 | 289.4 | 148.2 | 315.9 | 482.4 | 564.0 | 659.5 | 771.0 | 901.5 |
| EBIT, % | 15.98 | 13.78 | 13.63 | 5.06 | 8.76 | 11.44 | 11.44 | 11.44 | 11.44 | 11.44 |
| Total Cash | 309.1 | 673.0 | 793.4 | 847.3 | 848.3 | 1,173.0 | 1,371.5 | 1,603.5 | 1,874.9 | 2,192.1 |
| Total Cash, percent | .0 | .0 | .0 | .0 | .0 | .0 | .0 | .0 | .0 | .0 |
| Account Receivables | 719.7 | 781.2 | 964.2 | 1,172.0 | 1,507.2 | 1,708.1 | 1,997.1 | 2,335.0 | 2,730.1 | 3,192.0 |
| Account Receivables, % | 36.15 | 39.21 | 45.4 | 40.03 | 41.8 | 40.52 | 40.52 | 40.52 | 40.52 | 40.52 |
| Inventories | 128.3 | 170.9 | 233.4 | 231.8 | 189.8 | 330.4 | 386.3 | 451.7 | 528.1 | 617.5 |
| Inventories, % | 6.44 | 8.58 | 10.99 | 7.92 | 5.26 | 7.84 | 7.84 | 7.84 | 7.84 | 7.84 |
| Accounts Payable | 312.7 | 296.9 | 511.7 | 734.3 | 967.3 | 898.8 | 1,050.9 | 1,228.7 | 1,436.6 | 1,679.7 |
| Accounts Payable, % | 15.7 | 14.9 | 24.09 | 25.08 | 26.83 | 21.32 | 21.32 | 21.32 | 21.32 | 21.32 |
| Capital Expenditure | -132.1 | -67.7 | -31.3 | -82.8 | -97.8 | -143.7 | -168.0 | -196.5 | -229.7 | -268.6 |
| Capital Expenditure, % | -6.63 | -3.4 | -1.47 | -2.83 | -2.71 | -3.41 | -3.41 | -3.41 | -3.41 | -3.41 |
| Tax Rate, % | 29.13 | 29.13 | 29.13 | 29.13 | 29.13 | 29.13 | 29.13 | 29.13 | 29.13 | 29.13 |
| EBITAT | 234.6 | 199.8 | 208.3 | 98.0 | 223.9 | 342.9 | 401.0 | 468.8 | 548.1 | 640.9 |
| Depreciation | ||||||||||
| Changes in Account Receivables | ||||||||||
| Changes in Inventories | ||||||||||
| Changes in Accounts Payable | ||||||||||
| Capital Expenditure | ||||||||||
| UFCF | -412.5 | 45.7 | 180.1 | 74.6 | 102.6 | -153.6 | 106.9 | 125.0 | 146.1 | 170.8 |
| WACC, % | 7.92 | 7.92 | 7.92 | 7.92 | 7.92 | 7.92 | 7.92 | 7.92 | 7.92 | 7.92 |
| PV UFCF | ||||||||||
| SUM PV UFCF | 273.2 | |||||||||
| Long Term Growth Rate, % | 2.00 | |||||||||
| Free cash flow (T + 1) | 174 | |||||||||
| Terminal Value | 2,942 | |||||||||
| Present Terminal Value | 2,010 | |||||||||
| Enterprise Value | 2,283 | |||||||||
| Net Debt | -793 | |||||||||
| Equity Value | 3,076 | |||||||||
| Diluted Shares Outstanding, MM | 398 | |||||||||
| Equity Value Per Share | 7.73 |
What You Will Receive
- Authentic Xianheng Data: Comprehensive financials – encompassing revenue to EBIT – derived from real and projected statistics.
- Complete Customization: Modify all essential parameters (yellow cells) such as WACC, growth rates, and tax percentages.
- Instant Valuation Adjustments: Automatic recalculations for assessing the effects of changes on Xianheng’s fair value.
- Flexible Excel Template: Designed for quick updates, scenario analysis, and thorough forecasting.
- Efficient and Accurate: Eliminate the need to create models from the ground up while ensuring precision and adaptability.
Key Features
- Comprehensive Xianheng Data: Pre-loaded with the company’s historical financial performance and future projections.
- Highly Customizable Variables: Modify parameters such as revenue growth, profit margins, discount rates, tax obligations, and capital expenditures.
- Interactive Valuation Framework: Automatic recalculations of Net Present Value (NPV) and intrinsic value based on user-defined inputs.
- Versatile Scenario Analysis: Build and assess multiple financial scenarios to evaluate various valuation results.
- Intuitive User Interface: Designed with simplicity and clarity, suitable for both experienced professionals and newcomers.
How It Works
- Download: Obtain the pre-packaged Excel file featuring Xianheng International Science & Technology Co., Ltd.'s (605056SS) financial data.
- Customize: Modify projections, including revenue growth rates, EBITDA percentage, and WACC.
- Update Automatically: Watch as the intrinsic value and NPV calculations refresh in real-time.
- Test Scenarios: Generate various forecasts and quickly compare the results.
- Make Decisions: Leverage the valuation outcomes to inform your investment approach.
Why Select Xianheng International Science & Technology Co., Ltd.?
- Accuracy: Leverage precise financial data tailored for Xianheng International's operations.
- Flexibility: Users can easily adjust and experiment with various inputs to meet their needs.
- Time-Saving: Eliminate the complexities of creating financial models from the ground up.
- Professional-Grade: Crafted with the expertise and precision expected by industry leaders.
- User-Friendly: Intuitive design makes it accessible for all skill levels, regardless of financial modeling experience.
Who Would Benefit from This Product?
- Individual Investors: Gain insights to make informed decisions regarding investments in Xianheng International Science & Technology Co., Ltd. (605056SS).
- Financial Analysts: Enhance valuation techniques with comprehensive financial models tailored for Xianheng International Science & Technology Co., Ltd. (605056SS).
- Consultants: Provide clients with accurate and timely valuation analyses for Xianheng International Science & Technology Co., Ltd. (605056SS).
- Business Owners: Learn about the valuation approaches of large companies like Xianheng International Science & Technology Co., Ltd. (605056SS) to inform your strategic decisions.
- Finance Students: Explore practical valuation methods using real-time data and scenarios associated with Xianheng International Science & Technology Co., Ltd. (605056SS).
Contents of the Template
- Detailed DCF Model: An editable template featuring in-depth valuation calculations.
- Company-Specific Data: Xianheng International Science & Technology Co., Ltd.'s (605056SS) historical and projected financials included for analysis.
- Flexible Parameters: Modify WACC, growth rates, and tax assumptions to explore different scenarios.
- Comprehensive Financial Statements: Complete annual and quarterly reports for enhanced insights.
- Essential Ratios: Integrated analysis for assessing profitability, efficiency, and leverage.
- Dashboard with Visual Representations: Graphs and tables to present clear and actionable outcomes.
Disclaimer
All information, articles, and product details provided on this website are for general informational and educational purposes only. We do not claim any ownership over, nor do we intend to infringe upon, any trademarks, copyrights, logos, brand names, or other intellectual property mentioned or depicted on this site. Such intellectual property remains the property of its respective owners, and any references here are made solely for identification or informational purposes, without implying any affiliation, endorsement, or partnership.
We make no representations or warranties, express or implied, regarding the accuracy, completeness, or suitability of any content or products presented. Nothing on this website should be construed as legal, tax, investment, financial, medical, or other professional advice. In addition, no part of this site—including articles or product references—constitutes a solicitation, recommendation, endorsement, advertisement, or offer to buy or sell any securities, franchises, or other financial instruments, particularly in jurisdictions where such activity would be unlawful.
All content is of a general nature and may not address the specific circumstances of any individual or entity. It is not a substitute for professional advice or services. Any actions you take based on the information provided here are strictly at your own risk. You accept full responsibility for any decisions or outcomes arising from your use of this website and agree to release us from any liability in connection with your use of, or reliance upon, the content or products found herein.