
|
Cocreation Grass Co., Ltd (605099.Sss) DCF -Bewertung |
Fully Editable: Tailor To Your Needs In Excel Or Sheets
Professional Design: Trusted, Industry-Standard Templates
Investor-Approved Valuation Models
MAC/PC Compatible, Fully Unlocked
No Expertise Is Needed; Easy To Follow
CoCreation Grass Co., Ltd (605099.SS) Bundle
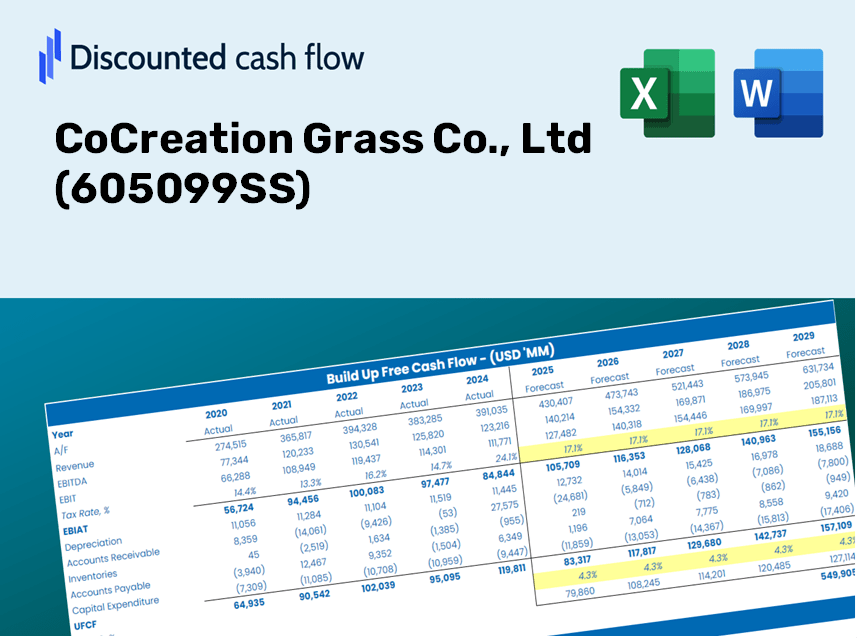
Als Investor oder Analyst ist der DCF-Taschenrechner des Cocreation Grass Co., Ltd (605099S) Ihr Anlaufwerk für eine genaue Bewertung. Ausgestattet mit echten Daten von CocoRation Grass Co., Ltd. können Sie problemlos Prognosen anpassen und die Effekte in Echtzeit beobachten.
Discounted Cash Flow (DCF) - (USD MM)
| Year | AY1 2020 |
AY2 2021 |
AY3 2022 |
AY4 2023 |
AY5 2024 |
FY1 2025 |
FY2 2026 |
FY3 2027 |
FY4 2028 |
FY5 2029 |
|---|---|---|---|---|---|---|---|---|---|---|
| Revenue | 1,850.3 | 2,301.7 | 2,470.8 | 2,461.4 | 2,951.8 | 3,330.3 | 3,757.3 | 4,239.1 | 4,782.6 | 5,395.8 |
| Revenue Growth, % | 0 | 24.39 | 7.35 | -0.3774 | 19.92 | 12.82 | 12.82 | 12.82 | 12.82 | 12.82 |
| EBITDA | 516.1 | 447.1 | 483.8 | 518.3 | 588.1 | 718.5 | 810.7 | 914.6 | 1,031.9 | 1,164.2 |
| EBITDA, % | 27.89 | 19.42 | 19.58 | 21.06 | 19.92 | 21.58 | 21.58 | 21.58 | 21.58 | 21.58 |
| Depreciation | 70.1 | 83.2 | 97.9 | 97.0 | 83.8 | 120.8 | 136.3 | 153.8 | 173.5 | 195.8 |
| Depreciation, % | 3.79 | 3.62 | 3.96 | 3.94 | 2.84 | 3.63 | 3.63 | 3.63 | 3.63 | 3.63 |
| EBIT | 446.1 | 363.8 | 385.9 | 421.3 | 504.3 | 597.7 | 674.3 | 760.8 | 858.3 | 968.4 |
| EBIT, % | 24.11 | 15.81 | 15.62 | 17.12 | 17.09 | 17.95 | 17.95 | 17.95 | 17.95 | 17.95 |
| Total Cash | 486.4 | 529.4 | 1,004.0 | 1,188.6 | 1,123.3 | 1,174.1 | 1,324.6 | 1,494.4 | 1,686.1 | 1,902.2 |
| Total Cash, percent | .0 | .0 | .0 | .0 | .0 | .0 | .0 | .0 | .0 | .0 |
| Account Receivables | 280.0 | 341.4 | 415.2 | 493.0 | 605.9 | 581.6 | 656.2 | 740.3 | 835.2 | 942.3 |
| Account Receivables, % | 15.13 | 14.83 | 16.8 | 20.03 | 20.53 | 17.46 | 17.46 | 17.46 | 17.46 | 17.46 |
| Inventories | 325.4 | 558.3 | 476.8 | 507.3 | 564.5 | 671.9 | 758.0 | 855.2 | 964.9 | 1,088.6 |
| Inventories, % | 17.59 | 24.26 | 19.3 | 20.61 | 19.12 | 20.17 | 20.17 | 20.17 | 20.17 | 20.17 |
| Accounts Payable | 80.4 | 114.4 | 78.2 | 84.1 | 109.7 | 130.6 | 147.4 | 166.3 | 187.6 | 211.7 |
| Accounts Payable, % | 4.34 | 4.97 | 3.17 | 3.42 | 3.72 | 3.92 | 3.92 | 3.92 | 3.92 | 3.92 |
| Capital Expenditure | -97.6 | -234.5 | -133.4 | -89.2 | -170.4 | -201.5 | -227.4 | -256.5 | -289.4 | -326.6 |
| Capital Expenditure, % | -5.27 | -10.19 | -5.4 | -3.63 | -5.77 | -6.05 | -6.05 | -6.05 | -6.05 | -6.05 |
| Tax Rate, % | 9.52 | 9.52 | 9.52 | 9.52 | 9.52 | 9.52 | 9.52 | 9.52 | 9.52 | 9.52 |
| EBITAT | 413.4 | 353.6 | 357.3 | 382.7 | 456.3 | 554.4 | 625.4 | 705.6 | 796.1 | 898.2 |
| Depreciation | ||||||||||
| Changes in Account Receivables | ||||||||||
| Changes in Inventories | ||||||||||
| Changes in Accounts Payable | ||||||||||
| Capital Expenditure | ||||||||||
| UFCF | -139.2 | -58.0 | 293.4 | 287.9 | 225.3 | 411.4 | 390.4 | 440.5 | 497.0 | 560.7 |
| WACC, % | 8.02 | 8.03 | 8.02 | 8.02 | 8.02 | 8.02 | 8.02 | 8.02 | 8.02 | 8.02 |
| PV UFCF | ||||||||||
| SUM PV UFCF | 1,810.9 | |||||||||
| Long Term Growth Rate, % | 3.00 | |||||||||
| Free cash flow (T + 1) | 577 | |||||||||
| Terminal Value | 11,493 | |||||||||
| Present Terminal Value | 7,813 | |||||||||
| Enterprise Value | 9,624 | |||||||||
| Net Debt | -790 | |||||||||
| Equity Value | 10,414 | |||||||||
| Diluted Shares Outstanding, MM | 399 | |||||||||
| Equity Value Per Share | 26.07 |
What You Will Receive
- Authentic CoCreation Grass Data: Preloaded financial metrics – covering everything from revenue to EBIT – based on both actual and projected figures.
- Comprehensive Customization: Modify all essential parameters (highlighted cells) including WACC, growth %, and tax rates.
- Immediate Valuation Adjustments: Automatic recalculations to assess the effects of changes on CoCreation Grass’s fair value.
- Flexible Excel Template: Designed for quick modifications, scenario analysis, and detailed forecasting.
- Efficient and Precise: Avoid the hassle of building models from scratch while ensuring accuracy and adaptability.
Key Features
- Customizable Forecasting Inputs: Adjust essential metrics such as revenue growth, EBITDA %, and capex to fit your analysis.
- Instant DCF Valuation: Automatically computes intrinsic value, NPV, and other financial metrics in real-time.
- High-Precision Accuracy: Leverages CoCreation Grass Co., Ltd's (605099SS) actual financial data for credible valuation results.
- Simplified Scenario Analysis: Effortlessly evaluate varying assumptions and assess their impacts on outcomes.
- Efficiency Booster: Streamline your workflow by avoiding the creation of intricate valuation models from the ground up.
How It Functions
- Download: Obtain the pre-configured Excel file containing CoCreation Grass Co., Ltd's (605099SS) financial data.
- Customize: Tailor your forecasts by adjusting metrics such as revenue growth, EBITDA %, and WACC.
- Update Automatically: Enjoy real-time updates on intrinsic value and NPV calculations.
- Test Scenarios: Establish various projections and compare results without delay.
- Make Decisions: Leverage the valuation outcomes to inform your investment approach.
Why Select CoCreation Grass Co., Ltd (605099SS)?
- Reliability: Leveraging authentic financial data for trustworthy insights.
- Adaptability: Built to empower users to experiment and adjust parameters effortlessly.
- Efficiency: Eliminate the need to create complex models from the ground up.
- Top-Tier Quality: Designed with executive-level accuracy and functionality in focus.
- Intuitive Interface: Simple to navigate, suitable for users with varying finance backgrounds.
Who Can Benefit from CoCreation Grass Co., Ltd (605099SS)?
- Individual Investors: Gain insights to make informed choices regarding investments in CoCreation Grass Co., Ltd (605099SS).
- Financial Analysts: Simplify valuation tasks with comprehensive financial models tailored for CoCreation Grass Co., Ltd (605099SS).
- Consultants: Provide clients with expert valuation analyses of CoCreation Grass Co., Ltd (605099SS) efficiently and accurately.
- Business Owners: Learn from the valuation strategies of successful companies like CoCreation Grass Co., Ltd (605099SS) to refine your own business approach.
- Finance Students: Explore real-world valuation methods and scenarios through the data of CoCreation Grass Co., Ltd (605099SS).
What the Template Includes
- Preloaded CoCreation Grass Data: Historical and projected financial information, encompassing revenue, EBIT, and capital expenditures.
- DCF and WACC Models: Professional-grade templates for calculating the intrinsic value and Weighted Average Cost of Capital.
- Editable Inputs: Yellow-highlighted cells for modifying revenue growth, tax rates, and discount rates.
- Financial Statements: Detailed annual and quarterly financials for in-depth analysis.
- Key Ratios: Metrics on profitability, leverage, and efficiency to assess performance.
- Dashboard and Charts: Visual representations of valuation results and underlying assumptions.
Disclaimer
All information, articles, and product details provided on this website are for general informational and educational purposes only. We do not claim any ownership over, nor do we intend to infringe upon, any trademarks, copyrights, logos, brand names, or other intellectual property mentioned or depicted on this site. Such intellectual property remains the property of its respective owners, and any references here are made solely for identification or informational purposes, without implying any affiliation, endorsement, or partnership.
We make no representations or warranties, express or implied, regarding the accuracy, completeness, or suitability of any content or products presented. Nothing on this website should be construed as legal, tax, investment, financial, medical, or other professional advice. In addition, no part of this site—including articles or product references—constitutes a solicitation, recommendation, endorsement, advertisement, or offer to buy or sell any securities, franchises, or other financial instruments, particularly in jurisdictions where such activity would be unlawful.
All content is of a general nature and may not address the specific circumstances of any individual or entity. It is not a substitute for professional advice or services. Any actions you take based on the information provided here are strictly at your own risk. You accept full responsibility for any decisions or outcomes arising from your use of this website and agree to release us from any liability in connection with your use of, or reliance upon, the content or products found herein.