
|
Hainan Huluwa Pharmaceutical Group Co., Ltd. (605199.Sss) DCF -Bewertung |
Fully Editable: Tailor To Your Needs In Excel Or Sheets
Professional Design: Trusted, Industry-Standard Templates
Investor-Approved Valuation Models
MAC/PC Compatible, Fully Unlocked
No Expertise Is Needed; Easy To Follow
Hainan Huluwa Pharmaceutical Group Co., Ltd. (605199.SS) Bundle
Verbessern Sie Ihre Anlagestrategien mit dem DCF -Taschenrechner (605199S)! Erforschen Sie die authentische Hainan Huluwa Pharmaceutical Group Co., Ltd. Financials, stellen Sie Wachstumsvorhersagen und -kosten an und beobachten Sie sofort, wie sich diese Modifikationen auf den inneren Wert von (605199S) auswirken.
Discounted Cash Flow (DCF) - (USD MM)
| Year | AY1 2020 |
AY2 2021 |
AY3 2022 |
AY4 2023 |
AY5 2024 |
FY1 2025 |
FY2 2026 |
FY3 2027 |
FY4 2028 |
FY5 2029 |
|---|---|---|---|---|---|---|---|---|---|---|
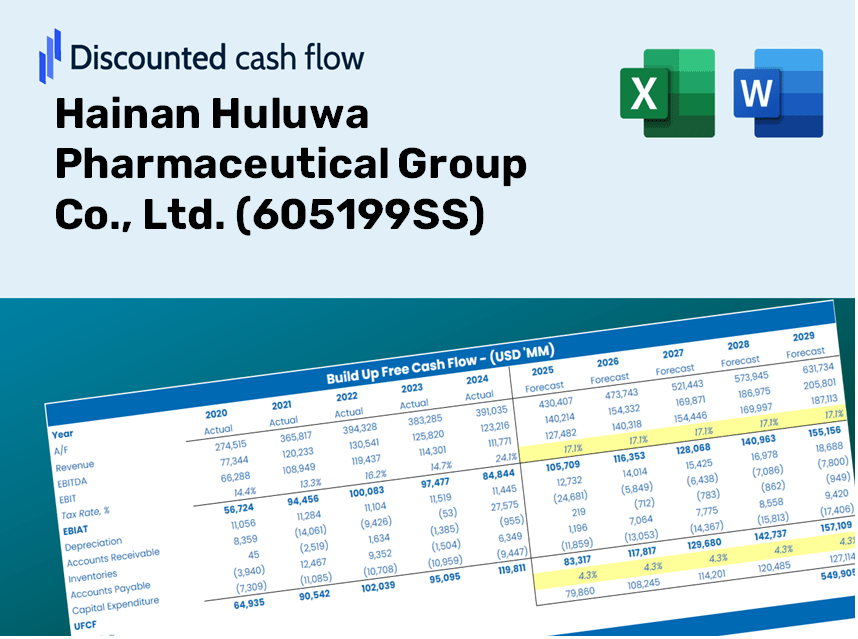
| Revenue | 1,161.7 | 1,353.8 | 1,515.0 | 1,795.2 | 1,413.5 | 1,504.3 | 1,600.9 | 1,703.6 | 1,813.0 | 1,929.4 |
| Revenue Growth, % | 0 | 16.53 | 11.91 | 18.49 | -21.26 | 6.42 | 6.42 | 6.42 | 6.42 | 6.42 |
| EBITDA | 189.5 | 148.2 | 167.7 | 104.1 | -159.6 | 98.8 | 105.1 | 111.9 | 119.0 | 126.7 |
| EBITDA, % | 16.31 | 10.95 | 11.07 | 5.8 | -11.29 | 6.57 | 6.57 | 6.57 | 6.57 | 6.57 |
| Depreciation | 43.8 | 48.4 | 51.6 | 59.7 | 77.8 | 58.9 | 62.7 | 66.7 | 71.0 | 75.6 |
| Depreciation, % | 3.77 | 3.57 | 3.4 | 3.33 | 5.51 | 3.92 | 3.92 | 3.92 | 3.92 | 3.92 |
| EBIT | 145.6 | 99.8 | 116.1 | 44.4 | -237.4 | 39.9 | 42.4 | 45.1 | 48.0 | 51.1 |
| EBIT, % | 12.54 | 7.37 | 7.66 | 2.47 | -16.8 | 2.65 | 2.65 | 2.65 | 2.65 | 2.65 |
| Total Cash | 345.9 | 487.7 | 480.4 | 522.7 | 254.3 | 435.1 | 463.0 | 492.7 | 524.3 | 558.0 |
| Total Cash, percent | .0 | .0 | .0 | .0 | .0 | .0 | .0 | .0 | .0 | .0 |
| Account Receivables | 414.3 | 359.6 | 456.6 | 590.1 | 419.5 | 466.1 | 496.0 | 527.8 | 561.7 | 597.8 |
| Account Receivables, % | 35.66 | 26.56 | 30.14 | 32.87 | 29.68 | 30.98 | 30.98 | 30.98 | 30.98 | 30.98 |
| Inventories | 186.0 | 213.2 | 213.6 | 265.6 | 446.8 | 277.6 | 295.4 | 314.3 | 334.5 | 356.0 |
| Inventories, % | 16.01 | 15.75 | 14.1 | 14.79 | 31.61 | 18.45 | 18.45 | 18.45 | 18.45 | 18.45 |
| Accounts Payable | 154.9 | 149.1 | 24.8 | 190.3 | 404.4 | 196.1 | 208.7 | 222.1 | 236.4 | 251.6 |
| Accounts Payable, % | 13.34 | 11.02 | 1.64 | 10.6 | 28.61 | 13.04 | 13.04 | 13.04 | 13.04 | 13.04 |
| Capital Expenditure | -59.4 | -137.6 | -392.3 | -489.2 | -156.2 | -239.1 | -254.5 | -270.8 | -288.2 | -306.7 |
| Capital Expenditure, % | -5.11 | -10.17 | -25.9 | -27.25 | -11.05 | -15.9 | -15.9 | -15.9 | -15.9 | -15.9 |
| Tax Rate, % | -1.97 | -1.97 | -1.97 | -1.97 | -1.97 | -1.97 | -1.97 | -1.97 | -1.97 | -1.97 |
| EBITAT | 131.7 | 88.1 | 102.3 | 34.9 | -242.1 | 35.5 | 37.8 | 40.2 | 42.8 | 45.6 |
| Depreciation | ||||||||||
| Changes in Account Receivables | ||||||||||
| Changes in Inventories | ||||||||||
| Changes in Accounts Payable | ||||||||||
| Capital Expenditure | ||||||||||
| UFCF | -329.3 | 20.6 | -460.1 | -414.5 | -117.1 | -230.2 | -189.1 | -201.3 | -214.2 | -227.9 |
| WACC, % | 9.6 | 9.59 | 9.58 | 9.51 | 9.68 | 9.59 | 9.59 | 9.59 | 9.59 | 9.59 |
| PV UFCF | ||||||||||
| SUM PV UFCF | -813.1 | |||||||||
| Long Term Growth Rate, % | 4.00 | |||||||||
| Free cash flow (T + 1) | -237 | |||||||||
| Terminal Value | -4,239 | |||||||||
| Present Terminal Value | -2,681 | |||||||||
| Enterprise Value | -3,494 | |||||||||
| Net Debt | 749 | |||||||||
| Equity Value | -4,243 | |||||||||
| Diluted Shares Outstanding, MM | 398 | |||||||||
| Equity Value Per Share | -10.67 |
What You Will Receive
- Genuine Hainan Huluwa Data: Preloaded financial information – encompassing revenue to EBIT – based on real and projected metrics.
- Comprehensive Customization: Modify all essential parameters (yellow cells) such as WACC, growth rate, and tax percentages.
- Immediate Valuation Adjustments: Automatic recalculations to assess the effects of changes on Hainan Huluwa's fair value.
- Flexible Excel Template: Designed for rapid alterations, scenario analysis, and thorough projections.
- Efficient and Precise: Avoid starting from square one while ensuring accuracy and adaptability.
Key Features
- Comprehensive DCF Calculator: Features detailed unlevered and levered DCF valuation models tailored for Hainan Huluwa Pharmaceutical Group Co., Ltd. (605199SS).
- WACC Calculator: Ready-to-use Weighted Average Cost of Capital sheet with adjustable parameters specific to the pharmaceutical industry.
- Customizable Forecast Assumptions: Adjust growth rates, capital investments, and discount rates as needed.
- Integrated Financial Ratios: Assess profitability, leverage, and efficiency ratios relevant to Hainan Huluwa Pharmaceutical Group Co., Ltd. (605199SS).
- Interactive Dashboard and Charts: Visual representations of key valuation metrics for streamlined analysis.
How It Operates
- Download: Obtain the ready-made Excel file containing Hainan Huluwa Pharmaceutical Group Co., Ltd.'s (605199SS) financial data.
- Customize: Tailor your forecasts, including revenue growth, EBITDA percentage, and WACC.
- Update Automatically: The intrinsic value and NPV calculations refresh in real-time.
- Test Scenarios: Develop various projections and instantly compare the results.
- Make Decisions: Utilize the valuation findings to inform your investment approach.
Why Choose This Calculator for Hainan Huluwa Pharmaceutical Group Co., Ltd. (605199SS)?
- Designed for Experts: A sophisticated tool utilized by financial analysts, CFOs, and industry consultants.
- Accurate Financial Data: Preloaded with Hainan Huluwa's historical and forecasted financial information for reliable insights.
- Flexible Scenario Analysis: Effortlessly explore various forecasts and assumptions to evaluate potential outcomes.
- Comprehensive Outputs: Instantly calculates intrinsic value, NPV, and other essential financial metrics.
- User-Friendly Interface: Step-by-step guidance ensures a smooth experience throughout the calculation process.
Who Should Consider This Product?
- Healthcare Investors: Develop comprehensive and accurate valuation models for portfolio assessments related to Hainan Huluwa Pharmaceutical Group Co., Ltd. (605199SS).
- Corporate Finance Departments: Evaluate valuation scenarios to inform strategic decisions within the organization.
- Consultants and Financial Advisors: Deliver precise valuation insights for clients interested in Hainan Huluwa Pharmaceutical Group Co., Ltd. (605199SS).
- Students and Educators: Utilize real-world data for practicing and teaching financial modeling in the pharmaceutical sector.
- Pharmaceutical Enthusiasts: Gain insights into how pharmaceutical companies like Hainan Huluwa are valued in the market.
Contents of the Template
- Operating and Balance Sheet Data: Pre-filled historical data and forecasts for Hainan Huluwa Pharmaceutical Group Co., Ltd. (605199SS), including revenue, EBITDA, EBIT, and capital expenditures.
- WACC Calculation: A dedicated sheet for Weighted Average Cost of Capital (WACC), featuring parameters such as Beta, risk-free rate, and share price.
- DCF Valuation (Unlevered and Levered): Customizable Discounted Cash Flow models that illustrate intrinsic value with comprehensive calculations.
- Financial Statements: Pre-loaded financial statements (annual and quarterly) designed to facilitate analysis.
- Key Ratios: A collection of profitability, leverage, and efficiency ratios pertinent to Hainan Huluwa Pharmaceutical Group Co., Ltd. (605199SS).
- Dashboard and Charts: Visual representation of valuation outputs and assumptions for straightforward result analysis.
Disclaimer
All information, articles, and product details provided on this website are for general informational and educational purposes only. We do not claim any ownership over, nor do we intend to infringe upon, any trademarks, copyrights, logos, brand names, or other intellectual property mentioned or depicted on this site. Such intellectual property remains the property of its respective owners, and any references here are made solely for identification or informational purposes, without implying any affiliation, endorsement, or partnership.
We make no representations or warranties, express or implied, regarding the accuracy, completeness, or suitability of any content or products presented. Nothing on this website should be construed as legal, tax, investment, financial, medical, or other professional advice. In addition, no part of this site—including articles or product references—constitutes a solicitation, recommendation, endorsement, advertisement, or offer to buy or sell any securities, franchises, or other financial instruments, particularly in jurisdictions where such activity would be unlawful.
All content is of a general nature and may not address the specific circumstances of any individual or entity. It is not a substitute for professional advice or services. Any actions you take based on the information provided here are strictly at your own risk. You accept full responsibility for any decisions or outcomes arising from your use of this website and agree to release us from any liability in connection with your use of, or reliance upon, the content or products found herein.