
|
Jiangsu Tongli Risheng Machinery Co., Ltd. (605286.SS) DCF -Bewertung |
Fully Editable: Tailor To Your Needs In Excel Or Sheets
Professional Design: Trusted, Industry-Standard Templates
Investor-Approved Valuation Models
MAC/PC Compatible, Fully Unlocked
No Expertise Is Needed; Easy To Follow
Jiangsu Tongli Risheng Machinery Co., Ltd. (605286.SS) Bundle
Als Investor oder Analyst dient der DCF -Taschenrechner von Jiangsu Tongli Risheng Machinery Co., Ltd. (605286S) als wesentliche Ressource für eine genaue Bewertung. Ausgestattet mit echten Daten von Jiangsu Tongli Risheng können Sie Prognosen anpassen und die Auswirkungen in Echtzeit beobachten.
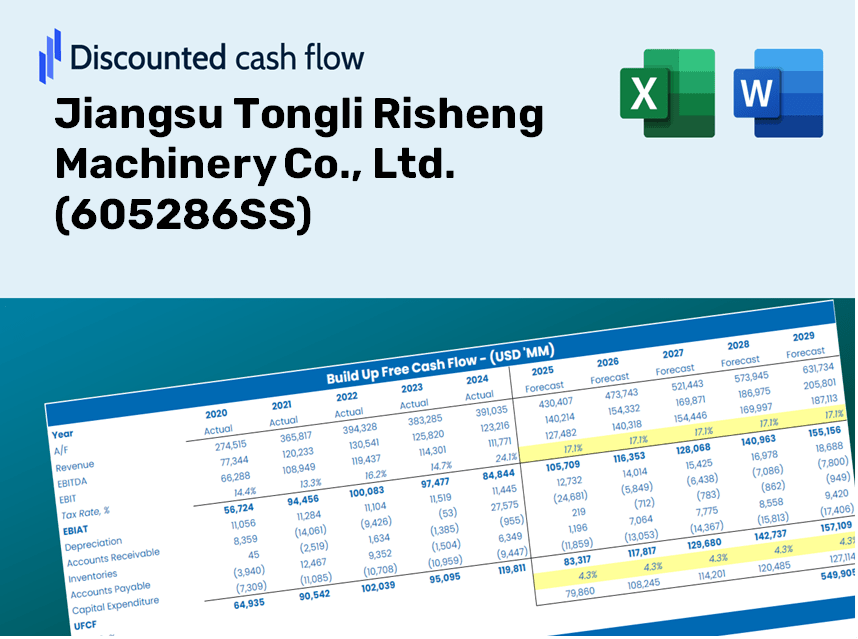
Discounted Cash Flow (DCF) - (USD MM)
| Year | AY1 2020 |
AY2 2021 |
AY3 2022 |
AY4 2023 |
AY5 2024 |
FY1 2025 |
FY2 2026 |
FY3 2027 |
FY4 2028 |
FY5 2029 |
|---|---|---|---|---|---|---|---|---|---|---|
| Revenue | 1,749.2 | 2,295.7 | 2,452.4 | 2,433.1 | 2,526.0 | 2,785.6 | 3,071.8 | 3,387.4 | 3,735.4 | 4,119.2 |
| Revenue Growth, % | 0 | 31.24 | 6.83 | -0.78769 | 3.82 | 10.27 | 10.27 | 10.27 | 10.27 | 10.27 |
| EBITDA | 208.0 | 212.6 | 208.5 | 366.5 | 499.3 | 359.2 | 396.2 | 436.9 | 481.8 | 531.2 |
| EBITDA, % | 11.89 | 9.26 | 8.5 | 15.06 | 19.77 | 12.9 | 12.9 | 12.9 | 12.9 | 12.9 |
| Depreciation | 28.9 | 33.6 | 41.0 | 54.1 | 54.2 | 51.0 | 56.2 | 62.0 | 68.4 | 75.4 |
| Depreciation, % | 1.65 | 1.46 | 1.67 | 2.23 | 2.14 | 1.83 | 1.83 | 1.83 | 1.83 | 1.83 |
| EBIT | 179.1 | 179.1 | 167.5 | 312.3 | 445.1 | 308.2 | 339.9 | 374.8 | 413.4 | 455.8 |
| EBIT, % | 10.24 | 7.8 | 6.83 | 12.84 | 17.62 | 11.07 | 11.07 | 11.07 | 11.07 | 11.07 |
| Total Cash | 127.1 | 484.6 | 748.2 | 727.5 | 604.5 | 627.9 | 692.5 | 763.6 | 842.1 | 928.6 |
| Total Cash, percent | .0 | .0 | .0 | .0 | .0 | .0 | .0 | .0 | .0 | .0 |
| Account Receivables | 402.5 | 650.5 | 789.5 | 1,045.4 | 1,415.9 | 1,017.0 | 1,121.5 | 1,236.8 | 1,363.8 | 1,504.0 |
| Account Receivables, % | 23.01 | 28.33 | 32.19 | 42.97 | 56.05 | 36.51 | 36.51 | 36.51 | 36.51 | 36.51 |
| Inventories | 200.7 | 268.0 | 228.7 | 522.9 | 295.6 | 365.8 | 403.4 | 444.9 | 490.6 | 541.0 |
| Inventories, % | 11.47 | 11.67 | 9.33 | 21.49 | 11.7 | 13.13 | 13.13 | 13.13 | 13.13 | 13.13 |
| Accounts Payable | 210.8 | 250.8 | 337.7 | 651.3 | 1,178.8 | 613.8 | 676.9 | 746.5 | 823.2 | 907.7 |
| Accounts Payable, % | 12.05 | 10.93 | 13.77 | 26.77 | 46.67 | 22.04 | 22.04 | 22.04 | 22.04 | 22.04 |
| Capital Expenditure | -45.9 | -65.7 | -67.6 | -174.0 | -508.4 | -197.9 | -218.2 | -240.7 | -265.4 | -292.7 |
| Capital Expenditure, % | -2.63 | -2.86 | -2.76 | -7.15 | -20.13 | -7.1 | -7.1 | -7.1 | -7.1 | -7.1 |
| Tax Rate, % | 43.6 | 43.6 | 43.6 | 43.6 | 43.6 | 43.6 | 43.6 | 43.6 | 43.6 | 43.6 |
| EBITAT | 152.5 | 155.9 | 155.8 | 226.3 | 251.1 | 243.0 | 267.9 | 295.5 | 325.8 | 359.3 |
| Depreciation | ||||||||||
| Changes in Account Receivables | ||||||||||
| Changes in Inventories | ||||||||||
| Changes in Accounts Payable | ||||||||||
| Capital Expenditure | ||||||||||
| UFCF | -256.8 | -151.5 | 116.3 | -130.1 | 181.2 | -140.3 | 26.9 | 29.7 | 32.8 | 36.1 |
| WACC, % | 4.64 | 4.65 | 4.66 | 4.62 | 4.6 | 4.63 | 4.63 | 4.63 | 4.63 | 4.63 |
| PV UFCF | ||||||||||
| SUM PV UFCF | -27.4 | |||||||||
| Long Term Growth Rate, % | 3.50 | |||||||||
| Free cash flow (T + 1) | 37 | |||||||||
| Terminal Value | 3,294 | |||||||||
| Present Terminal Value | 2,626 | |||||||||
| Enterprise Value | 2,599 | |||||||||
| Net Debt | -275 | |||||||||
| Equity Value | 2,873 | |||||||||
| Diluted Shares Outstanding, MM | 174 | |||||||||
| Equity Value Per Share | 16.56 |
What You Will Receive
- Genuine Jiangsu Tongli Risheng Financials: Access to both historical and projected data for precise valuation.
- Customizable Parameters: Adjust WACC, tax rates, revenue growth, and capital expenditures as needed.
- Dynamic Calculations: Intrinsic value and NPV are computed in real-time.
- Scenario Analysis Tools: Evaluate various scenarios to assess the future performance of Jiangsu Tongli Risheng.
- User-Friendly Interface: Designed for industry professionals while remaining approachable for newcomers.
Key Features
- 🔍 Real-Life 605286SS Financials: Pre-filled historical and projected data for Jiangsu Tongli Risheng Machinery Co., Ltd.
- ✏️ Fully Customizable Inputs: Modify essential parameters (yellow cells) including WACC, growth %, and tax rates.
- 📊 Professional DCF Valuation: Integrated formulas to determine the intrinsic value of Jiangsu Tongli Risheng using the Discounted Cash Flow method.
- ⚡ Instant Results: Observe Jiangsu Tongli Risheng’s valuation in real time after any adjustments.
- Scenario Analysis: Evaluate and compare results for different financial assumptions side-by-side.
How It Functions
- Step 1: Download the Excel spreadsheet.
- Step 2: Review the pre-populated financial data and projections for Jiangsu Tongli Risheng Machinery Co., Ltd. (605286SS).
- Step 3: Adjust key inputs such as revenue growth, WACC, and tax rates (highlighted cells).
- Step 4: Observe the DCF model refresh in real-time as you modify your assumptions.
- Step 5: Evaluate the results and incorporate them into your investment strategies.
Why Opt for This Calculator?
- Reliable Data: Access authentic financials from Jiangsu Tongli Risheng Machinery Co., Ltd. (605286SS) for trustworthy valuation outcomes.
- Flexible Options: Modify essential parameters such as growth rates, WACC, and tax rates to align with your forecasts.
- Efficient: Pre-configured calculations save you the hassle of starting from the ground up.
- Industry-Grade Tool: Tailored for investors, analysts, and consultants in the field.
- Easy to Use: User-friendly design and clear, step-by-step guidance ensure accessibility for everyone.
Who Can Benefit from This Product?
- Engineering Students: Master machinery design principles and apply them to real-world scenarios.
- Researchers: Utilize industry-specific data in your studies or presentations.
- Manufacturing Investors: Evaluate your investment strategies and assess performance metrics for Jiangsu Tongli Risheng Machinery Co., Ltd. (605286SS).
- Market Analysts: Enhance your analysis with a user-friendly, adaptable DCF model tailored for machinery firms.
- Entrepreneurs: Discover how established companies like Jiangsu Tongli Risheng Machinery Co., Ltd. (605286SS) are evaluated in the market.
Contents of the Template
- Comprehensive DCF Model: An editable framework featuring thorough valuation calculations.
- Real-World Data: Historical and projected financial information for Jiangsu Tongli Risheng Machinery Co., Ltd. preloaded for analysis.
- Customizable Parameters: Modify WACC, growth rates, and tax assumptions to explore different scenarios.
- Financial Statements: Detailed annual and quarterly financial breakdowns for enhanced insights.
- Key Ratios: Integrated analysis of profitability, efficiency, and leverage metrics.
- Dashboard with Visual Outputs: Charts and tables designed for clear, actionable results.
Disclaimer
All information, articles, and product details provided on this website are for general informational and educational purposes only. We do not claim any ownership over, nor do we intend to infringe upon, any trademarks, copyrights, logos, brand names, or other intellectual property mentioned or depicted on this site. Such intellectual property remains the property of its respective owners, and any references here are made solely for identification or informational purposes, without implying any affiliation, endorsement, or partnership.
We make no representations or warranties, express or implied, regarding the accuracy, completeness, or suitability of any content or products presented. Nothing on this website should be construed as legal, tax, investment, financial, medical, or other professional advice. In addition, no part of this site—including articles or product references—constitutes a solicitation, recommendation, endorsement, advertisement, or offer to buy or sell any securities, franchises, or other financial instruments, particularly in jurisdictions where such activity would be unlawful.
All content is of a general nature and may not address the specific circumstances of any individual or entity. It is not a substitute for professional advice or services. Any actions you take based on the information provided here are strictly at your own risk. You accept full responsibility for any decisions or outcomes arising from your use of this website and agree to release us from any liability in connection with your use of, or reliance upon, the content or products found herein.