
|
Kunshan Huguang Auto Havess Co., Ltd. (605333.SS) DCF -Bewertung |
Fully Editable: Tailor To Your Needs In Excel Or Sheets
Professional Design: Trusted, Industry-Standard Templates
Investor-Approved Valuation Models
MAC/PC Compatible, Fully Unlocked
No Expertise Is Needed; Easy To Follow
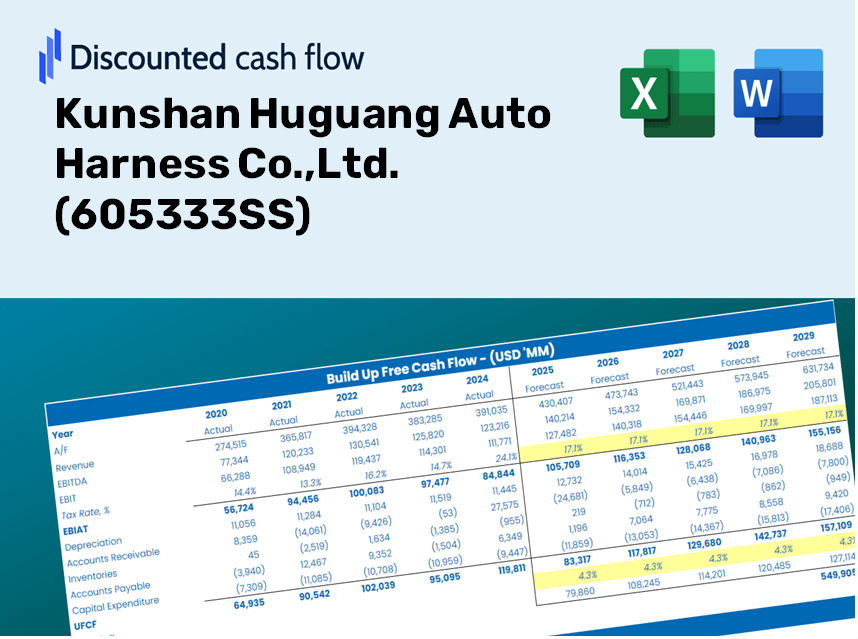
Kunshan Huguang Auto Harness Co.,Ltd. (605333.SS) Bundle
Unser (605333S) DCF-Taschenrechner, der für die Genauigkeit entwickelt wurde, ermöglicht es Ihnen, Kunshan Huguang Auto Harness Co., Ltd., unter Verwendung realer Finanzdaten zu bewerten und vollständige Flexibilität zu bieten, um alle wesentlichen Parameter für erweiterte Projektionen zu ändern.
Discounted Cash Flow (DCF) - (USD MM)
| Year | AY1 2020 |
AY2 2021 |
AY3 2022 |
AY4 2023 |
AY5 2024 |
FY1 2025 |
FY2 2026 |
FY3 2027 |
FY4 2028 |
FY5 2029 |
|---|---|---|---|---|---|---|---|---|---|---|
| Revenue | 1,531.2 | 2,447.8 | 3,277.9 | 4,002.8 | 7,913.5 | 12,139.1 | 18,621.1 | 28,564.3 | 43,816.9 | 67,214.0 |
| Revenue Growth, % | 0 | 59.86 | 33.91 | 22.11 | 97.7 | 53.4 | 53.4 | 53.4 | 53.4 | 53.4 |
| EBITDA | 148.0 | 88.3 | 185.8 | 295.6 | 993.7 | 944.0 | 1,448.1 | 2,221.4 | 3,407.5 | 5,227.1 |
| EBITDA, % | 9.67 | 3.61 | 5.67 | 7.38 | 12.56 | 7.78 | 7.78 | 7.78 | 7.78 | 7.78 |
| Depreciation | 59.6 | 83.6 | 118.8 | 171.0 | 208.0 | 432.9 | 664.1 | 1,018.7 | 1,562.7 | 2,397.2 |
| Depreciation, % | 3.89 | 3.42 | 3.62 | 4.27 | 2.63 | 3.57 | 3.57 | 3.57 | 3.57 | 3.57 |
| EBIT | 88.4 | 4.7 | 67.0 | 124.6 | 785.7 | 511.1 | 784.0 | 1,202.6 | 1,844.8 | 2,829.9 |
| EBIT, % | 5.77 | 0.19114 | 2.04 | 3.11 | 9.93 | 4.21 | 4.21 | 4.21 | 4.21 | 4.21 |
| Total Cash | 74.0 | 221.9 | 272.9 | 353.3 | 496.6 | 906.1 | 1,390.0 | 2,132.2 | 3,270.7 | 5,017.2 |
| Total Cash, percent | .0 | .0 | .0 | .0 | .0 | .0 | .0 | .0 | .0 | .0 |
| Account Receivables | 679.3 | 1,174.6 | 1,435.4 | 2,155.0 | 3,035.8 | 5,543.8 | 8,504.0 | 13,044.9 | 20,010.5 | 30,695.7 |
| Account Receivables, % | 44.36 | 47.99 | 43.79 | 53.84 | 38.36 | 45.67 | 45.67 | 45.67 | 45.67 | 45.67 |
| Inventories | 243.8 | 410.2 | 749.3 | 721.0 | 771.0 | 2,022.3 | 3,102.1 | 4,758.6 | 7,299.6 | 11,197.4 |
| Inventories, % | 15.92 | 16.76 | 22.86 | 18.01 | 9.74 | 16.66 | 16.66 | 16.66 | 16.66 | 16.66 |
| Accounts Payable | 357.1 | 852.7 | 1,214.8 | 1,904.2 | 2,523.1 | 4,240.7 | 6,505.2 | 9,978.8 | 15,307.2 | 23,480.8 |
| Accounts Payable, % | 23.32 | 34.83 | 37.06 | 47.57 | 31.88 | 34.93 | 34.93 | 34.93 | 34.93 | 34.93 |
| Capital Expenditure | -160.5 | -166.6 | -653.7 | -405.5 | -504.2 | -1,304.4 | -2,001.0 | -3,069.5 | -4,708.5 | -7,222.7 |
| Capital Expenditure, % | -10.48 | -6.8 | -19.94 | -10.13 | -6.37 | -10.75 | -10.75 | -10.75 | -10.75 | -10.75 |
| Tax Rate, % | 8.41 | 8.41 | 8.41 | 8.41 | 8.41 | 8.41 | 8.41 | 8.41 | 8.41 | 8.41 |
| EBITAT | 85.8 | .3 | 90.5 | 97.8 | 719.7 | 381.2 | 584.8 | 897.0 | 1,376.0 | 2,110.7 |
| Depreciation | ||||||||||
| Changes in Account Receivables | ||||||||||
| Changes in Inventories | ||||||||||
| Changes in Accounts Payable | ||||||||||
| Capital Expenditure | ||||||||||
| UFCF | -581.1 | -248.8 | -682.1 | -138.7 | 111.6 | -2,531.9 | -2,527.8 | -3,877.5 | -5,948.0 | -9,124.1 |
| WACC, % | 7.94 | 7.56 | 7.95 | 7.86 | 7.92 | 7.85 | 7.85 | 7.85 | 7.85 | 7.85 |
| PV UFCF | ||||||||||
| SUM PV UFCF | -18,262.7 | |||||||||
| Long Term Growth Rate, % | 4.00 | |||||||||
| Free cash flow (T + 1) | -9,489 | |||||||||
| Terminal Value | -246,641 | |||||||||
| Present Terminal Value | -169,051 | |||||||||
| Enterprise Value | -187,314 | |||||||||
| Net Debt | 920 | |||||||||
| Equity Value | -188,234 | |||||||||
| Diluted Shares Outstanding, MM | 438 | |||||||||
| Equity Value Per Share | -429.63 |
What You Will Receive
- Accurate 605333SS Financial Data: Pre-populated with Kunshan Huguang Auto Harness Co., Ltd.'s historical and forecasted figures for in-depth analysis.
- Customizable Template: Easily adjust essential inputs such as revenue growth, WACC, and EBITDA margins.
- Instant Calculations: Watch the intrinsic value of Kunshan Huguang update automatically as you make changes.
- Professional Valuation Tool: Tailored for investors, analysts, and consultants aiming for precise DCF outcomes.
- User-Friendly Interface: Designed with a straightforward layout and clear instructions suitable for all skill levels.
Core Features
- Comprehensive Data: Access to Kunshan Huguang Auto Harness Co., Ltd.’s (605333SS) historical performance metrics and industry benchmarks.
- Customizable Parameters: Modify production costs, market forecasts, and profit margins according to your needs.
- Real-Time Insights: Instantly view the recalibrated market value of Kunshan Huguang Auto Harness Co., Ltd. (605333SS).
- Interactive Visuals: Engaging dashboard graphs showcase valuation outcomes and essential indicators.
- Designed for Precision: A reliable resource tailored for analysts, investors, and finance professionals.
How It Works
- Step 1: Download the prebuilt Excel template featuring data on Kunshan Huguang Auto Harness Co., Ltd. (605333SS).
- Step 2: Navigate through the pre-filled sheets to familiarize yourself with the essential metrics.
- Step 3: Modify forecasts and assumptions in the editable yellow cells (WACC, growth, margins).
- Step 4: Instantly view updated results, including the intrinsic value of Kunshan Huguang Auto Harness Co., Ltd. (605333SS).
- Step 5: Utilize the outputs to make well-informed investment decisions or create detailed reports.
Why Select This Calculator?
- User-Friendly Interface: Crafted for both novices and seasoned users.
- Customizable Inputs: Adjust variables effortlessly to suit your analysis.
- Real-Time Feedback: Observe immediate changes to Kunshan Huguang Auto Harness Co.,Ltd. (605333SS) valuation as you tweak inputs.
- Ready to Use: Comes pre-loaded with Kunshan Huguang's actual financial metrics for swift evaluation.
- Endorsed by Experts: Utilized by investors and analysts for making informed choices.
Who Should Use This Product?
- Individual Investors: Make well-informed decisions about investing in Kunshan Huguang Auto Harness Co., Ltd. (605333SS) shares.
- Financial Analysts: Enhance valuation assessments with comprehensive financial models specific to Kunshan Huguang Auto Harness Co., Ltd. (605333SS).
- Consultants: Provide clients with timely and accurate valuation insights regarding Kunshan Huguang Auto Harness Co., Ltd. (605333SS).
- Business Owners: Gain insights into the valuation of established firms like Kunshan Huguang Auto Harness Co., Ltd. (605333SS) to inform your own business strategies.
- Finance Students: Master valuation techniques through the analysis of real-world data related to Kunshan Huguang Auto Harness Co., Ltd. (605333SS).
Contents of the Template
- Operating and Balance Sheet Data: Pre-filled historical data and forecasts for Kunshan Huguang Auto Harness Co., Ltd. (605333SS), including revenue, EBITDA, EBIT, and capital expenditures.
- WACC Calculation: A dedicated sheet for Weighted Average Cost of Capital (WACC), featuring parameters such as Beta, risk-free rate, and share price.
- DCF Valuation (Unlevered and Levered): Customizable Discounted Cash Flow models detailing intrinsic value with comprehensive calculations.
- Financial Statements: Pre-loaded annual and quarterly financial statements to aid in analysis.
- Key Ratios: Incorporates profitability, leverage, and efficiency ratios for Kunshan Huguang Auto Harness Co., Ltd. (605333SS).
- Dashboard and Charts: Visual representation of valuation outputs and assumptions for quick analysis of results.
Disclaimer
All information, articles, and product details provided on this website are for general informational and educational purposes only. We do not claim any ownership over, nor do we intend to infringe upon, any trademarks, copyrights, logos, brand names, or other intellectual property mentioned or depicted on this site. Such intellectual property remains the property of its respective owners, and any references here are made solely for identification or informational purposes, without implying any affiliation, endorsement, or partnership.
We make no representations or warranties, express or implied, regarding the accuracy, completeness, or suitability of any content or products presented. Nothing on this website should be construed as legal, tax, investment, financial, medical, or other professional advice. In addition, no part of this site—including articles or product references—constitutes a solicitation, recommendation, endorsement, advertisement, or offer to buy or sell any securities, franchises, or other financial instruments, particularly in jurisdictions where such activity would be unlawful.
All content is of a general nature and may not address the specific circumstances of any individual or entity. It is not a substitute for professional advice or services. Any actions you take based on the information provided here are strictly at your own risk. You accept full responsibility for any decisions or outcomes arising from your use of this website and agree to release us from any liability in connection with your use of, or reliance upon, the content or products found herein.