
|
Henan Lantian Gas Co., Ltd. (605368.SS) DCF -Bewertung |
Fully Editable: Tailor To Your Needs In Excel Or Sheets
Professional Design: Trusted, Industry-Standard Templates
Investor-Approved Valuation Models
MAC/PC Compatible, Fully Unlocked
No Expertise Is Needed; Easy To Follow
Henan Lantian Gas Co.,Ltd. (605368.SS) Bundle
Entdecken Sie das wahre Potenzial von Henan Lantian Gas Co., Ltd. (605368S) mit unserem fortschrittlichen DCF -Taschenrechner! Passen Sie wesentliche Annahmen an, bewerten Sie verschiedene Szenarien und untersuchen, wie sich Schwankungen auf die Bewertung von Henan Lantian Gas Co., Ltd. (605368S) auswirken - alles innerhalb einer Excel -Vorlage.
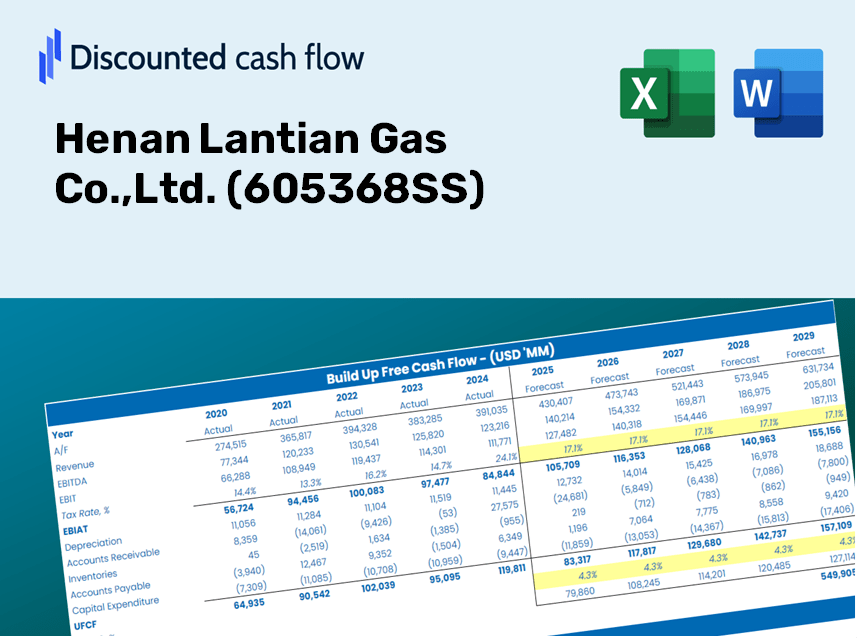
Discounted Cash Flow (DCF) - (USD MM)
| Year | AY1 2020 |
AY2 2021 |
AY3 2022 |
AY4 2023 |
AY5 2024 |
FY1 2025 |
FY2 2026 |
FY3 2027 |
FY4 2028 |
FY5 2029 |
|---|---|---|---|---|---|---|---|---|---|---|
| Revenue | 3,551.8 | 3,900.9 | 4,753.7 | 4,946.8 | 4,755.4 | 5,134.4 | 5,543.7 | 5,985.5 | 6,462.6 | 6,977.7 |
| Revenue Growth, % | 0 | 9.83 | 21.86 | 4.06 | -3.87 | 7.97 | 7.97 | 7.97 | 7.97 | 7.97 |
| EBITDA | 603.9 | 700.7 | 958.9 | 1,030.4 | 902.1 | 974.9 | 1,052.6 | 1,136.5 | 1,227.0 | 1,324.9 |
| EBITDA, % | 17 | 17.96 | 20.17 | 20.83 | 18.97 | 18.99 | 18.99 | 18.99 | 18.99 | 18.99 |
| Depreciation | 115.5 | 126.2 | 153.1 | 184.0 | 193.6 | 179.7 | 194.0 | 209.5 | 226.2 | 244.2 |
| Depreciation, % | 3.25 | 3.24 | 3.22 | 3.72 | 4.07 | 3.5 | 3.5 | 3.5 | 3.5 | 3.5 |
| EBIT | 488.3 | 574.5 | 805.8 | 846.5 | 708.4 | 795.2 | 858.6 | 927.0 | 1,000.9 | 1,080.6 |
| EBIT, % | 13.75 | 14.73 | 16.95 | 17.11 | 14.9 | 15.49 | 15.49 | 15.49 | 15.49 | 15.49 |
| Total Cash | 567.1 | 1,188.0 | 1,212.6 | 1,716.6 | 1,262.3 | 1,367.6 | 1,476.6 | 1,594.3 | 1,721.3 | 1,858.5 |
| Total Cash, percent | .0 | .0 | .0 | .0 | .0 | .0 | .0 | .0 | .0 | .0 |
| Account Receivables | 44.6 | 86.8 | 163.8 | 148.6 | 180.6 | 141.0 | 152.2 | 164.3 | 177.4 | 191.6 |
| Account Receivables, % | 1.25 | 2.22 | 3.45 | 3 | 3.8 | 2.75 | 2.75 | 2.75 | 2.75 | 2.75 |
| Inventories | 52.6 | 135.0 | 197.6 | 195.0 | 215.2 | 180.4 | 194.8 | 210.3 | 227.0 | 245.1 |
| Inventories, % | 1.48 | 3.46 | 4.16 | 3.94 | 4.53 | 3.51 | 3.51 | 3.51 | 3.51 | 3.51 |
| Accounts Payable | 238.5 | 321.6 | 368.7 | 211.4 | 228.7 | 326.5 | 352.5 | 380.6 | 411.0 | 443.7 |
| Accounts Payable, % | 6.72 | 8.24 | 7.76 | 4.27 | 4.81 | 6.36 | 6.36 | 6.36 | 6.36 | 6.36 |
| Capital Expenditure | -198.8 | -397.7 | -434.0 | -294.3 | -199.4 | -360.1 | -388.8 | -419.8 | -453.2 | -489.3 |
| Capital Expenditure, % | -5.6 | -10.19 | -9.13 | -5.95 | -4.19 | -7.01 | -7.01 | -7.01 | -7.01 | -7.01 |
| Tax Rate, % | 23.7 | 23.7 | 23.7 | 23.7 | 23.7 | 23.7 | 23.7 | 23.7 | 23.7 | 23.7 |
| EBITAT | 361.9 | 444.0 | 622.5 | 638.9 | 540.5 | 605.0 | 653.2 | 705.3 | 761.5 | 822.2 |
| Depreciation | ||||||||||
| Changes in Account Receivables | ||||||||||
| Changes in Inventories | ||||||||||
| Changes in Accounts Payable | ||||||||||
| Capital Expenditure | ||||||||||
| UFCF | 420.0 | 131.0 | 248.9 | 389.1 | 499.8 | 596.9 | 458.9 | 495.4 | 534.9 | 577.6 |
| WACC, % | 4.85 | 4.87 | 4.87 | 4.86 | 4.87 | 4.87 | 4.87 | 4.87 | 4.87 | 4.87 |
| PV UFCF | ||||||||||
| SUM PV UFCF | 2,313.9 | |||||||||
| Long Term Growth Rate, % | 1.00 | |||||||||
| Free cash flow (T + 1) | 583 | |||||||||
| Terminal Value | 15,090 | |||||||||
| Present Terminal Value | 11,899 | |||||||||
| Enterprise Value | 14,213 | |||||||||
| Net Debt | 9 | |||||||||
| Equity Value | 14,204 | |||||||||
| Diluted Shares Outstanding, MM | 740 | |||||||||
| Equity Value Per Share | 19.19 |
Benefits You Will Enjoy
- Comprehensive HNG (605368SS) Financial Data: Pre-filled with Henan Lantian Gas Co., Ltd.’s historical and projected figures for accurate analysis.
- Customizable Template: Easily adjust key metrics such as revenue growth, WACC, and EBITDA percentage.
- Instant Calculations: Watch HNG’s intrinsic value update in real-time as you make changes.
- Expert Valuation Tool: Tailored for investors, analysts, and consultants aiming for precise DCF results.
- Intuitive Design: User-friendly layout and straightforward guidance suitable for all skill levels.
Key Features
- Customizable Forecast Inputs: Adjust essential factors such as revenue growth, EBITDA %, and capital expenditures.
- Instant DCF Valuation: Quickly computes intrinsic value, NPV, and additional financial metrics.
- Highly Accurate Valuations: Leverages Henan Lantian Gas Co., Ltd.'s (605368SS) actual financial data for realistic assessments.
- Simplified Scenario Analysis: Effortlessly evaluate various assumptions and analyze different outcomes.
- Efficiency Booster: Streamlines the valuation process, removing the need to develop complex models from the ground up.
How It Works
- Step 1: Download the prebuilt Excel template containing Henan Lantian Gas Co.,Ltd. (605368SS) data.
- Step 2: Review the pre-filled sheets to familiarize yourself with the key performance indicators.
- Step 3: Modify the forecasts and assumptions in the editable yellow cells (WACC, growth, margins).
- Step 4: Instantly see the recalculated results, including the intrinsic value of Henan Lantian Gas Co.,Ltd. (605368SS).
- Step 5: Utilize the outputs to make well-informed investment decisions or create detailed reports.
Why Choose Henan Lantian Gas Co., Ltd. (605368SS)?
- All-in-One Solution: Combines essential tools like DCF, WACC, and financial ratio analyses in a single platform.
- Flexible Input Options: Modify yellow-highlighted fields to explore different scenarios.
- In-Depth Analysis: Automatically computes the intrinsic value and Net Present Value for Henan Lantian Gas.
- Preloaded Information: Access comprehensive historical and forecasted data for precise evaluations.
- High-Quality Standards: Perfect for financial analysts, investors, and business advisors.
Who Can Benefit from This Product?
- Investors: Evaluate Henan Lantian Gas Co.,Ltd.'s (605368SS) valuation to make informed decisions on buying or selling shares.
- CFOs and Financial Analysts: Enhance valuation processes and assess financial projections for Henan Lantian Gas Co.,Ltd. (605368SS).
- Startup Founders: Understand how companies like Henan Lantian Gas Co.,Ltd. (605368SS) are valued in the market.
- Consultants: Create in-depth valuation reports for clients featuring Henan Lantian Gas Co.,Ltd. (605368SS).
- Students and Educators: Utilize real market data to practice and teach valuation strategies with a focus on Henan Lantian Gas Co.,Ltd. (605368SS).
Contents of the Template
- Preloaded HNGC Data: Historical and projected financial metrics, including revenue, EBIT, and capital expenditures.
- DCF and WACC Models: Advanced spreadsheets designed for calculating intrinsic value and Weighted Average Cost of Capital.
- Editable Inputs: Yellow-highlighted cells to modify revenue growth, tax rates, and discount rates.
- Financial Statements: Detailed annual and quarterly financials for thorough analysis.
- Key Ratios: Ratios of profitability, leverage, and efficiency to assess performance.
- Dashboard and Charts: Visual representations of valuation results and underlying assumptions.
Disclaimer
All information, articles, and product details provided on this website are for general informational and educational purposes only. We do not claim any ownership over, nor do we intend to infringe upon, any trademarks, copyrights, logos, brand names, or other intellectual property mentioned or depicted on this site. Such intellectual property remains the property of its respective owners, and any references here are made solely for identification or informational purposes, without implying any affiliation, endorsement, or partnership.
We make no representations or warranties, express or implied, regarding the accuracy, completeness, or suitability of any content or products presented. Nothing on this website should be construed as legal, tax, investment, financial, medical, or other professional advice. In addition, no part of this site—including articles or product references—constitutes a solicitation, recommendation, endorsement, advertisement, or offer to buy or sell any securities, franchises, or other financial instruments, particularly in jurisdictions where such activity would be unlawful.
All content is of a general nature and may not address the specific circumstances of any individual or entity. It is not a substitute for professional advice or services. Any actions you take based on the information provided here are strictly at your own risk. You accept full responsibility for any decisions or outcomes arising from your use of this website and agree to release us from any liability in connection with your use of, or reliance upon, the content or products found herein.