
|
Eastroc Beverage Co., Ltd. (605499.SS) DCF -Bewertung |
Fully Editable: Tailor To Your Needs In Excel Or Sheets
Professional Design: Trusted, Industry-Standard Templates
Investor-Approved Valuation Models
MAC/PC Compatible, Fully Unlocked
No Expertise Is Needed; Easy To Follow
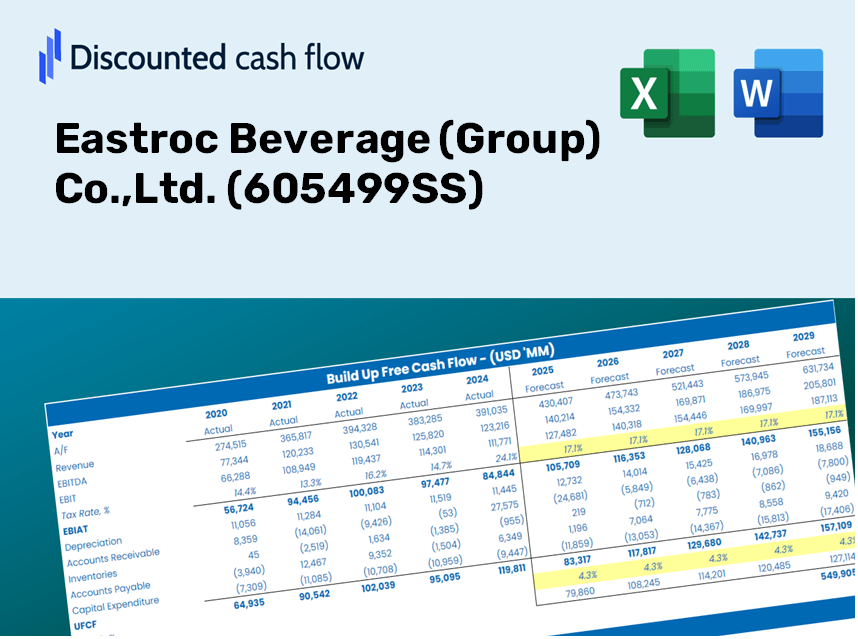
Eastroc Beverage (Group) Co.,Ltd. (605499.SS) Bundle
Maximieren Sie die Effizienz und verbessern Sie die Präzision mit unserem DCF -Taschenrechner (605499S)! Mit realen Daten von Eastroc Beverage (Group) Co., Ltd. und anpassbaren Annahmen ermöglichen dieses Tool Sie, Eastroc Beverage wie ein erfahrener Investor prognostizieren, analysieren und bewerten.
Discounted Cash Flow (DCF) - (USD MM)
| Year | AY1 2020 |
AY2 2021 |
AY3 2022 |
AY4 2023 |
AY5 2024 |
FY1 2025 |
FY2 2026 |
FY3 2027 |
FY4 2028 |
FY5 2029 |
|---|---|---|---|---|---|---|---|---|---|---|
| Revenue | 4,958.5 | 6,977.8 | 8,505.4 | 11,262.8 | 15,838.9 | 21,210.8 | 28,404.8 | 38,038.6 | 50,939.9 | 68,216.9 |
| Revenue Growth, % | 0 | 40.72 | 21.89 | 32.42 | 40.63 | 33.92 | 33.92 | 33.92 | 33.92 | 33.92 |
| EBITDA | 1,132.8 | 1,540.7 | 1,980.7 | 2,606.2 | 4,115.7 | 4,977.7 | 6,665.9 | 8,926.7 | 11,954.4 | 16,008.9 |
| EBITDA, % | 22.85 | 22.08 | 23.29 | 23.14 | 25.98 | 23.47 | 23.47 | 23.47 | 23.47 | 23.47 |
| Depreciation | 131.6 | 182.0 | 220.5 | 249.7 | 335.6 | 517.2 | 692.6 | 927.5 | 1,242.0 | 1,663.3 |
| Depreciation, % | 2.65 | 2.61 | 2.59 | 2.22 | 2.12 | 2.44 | 2.44 | 2.44 | 2.44 | 2.44 |
| EBIT | 1,001.2 | 1,358.7 | 1,760.2 | 2,356.5 | 3,780.1 | 4,460.5 | 5,973.3 | 7,999.3 | 10,712.3 | 14,345.6 |
| EBIT, % | 20.19 | 19.47 | 20.7 | 20.92 | 23.87 | 21.03 | 21.03 | 21.03 | 21.03 | 21.03 |
| Total Cash | 1,274.9 | 1,320.4 | 4,194.7 | 7,296.2 | 10,549.8 | 9,559.3 | 12,801.4 | 17,143.2 | 22,957.6 | 30,744.0 |
| Total Cash, percent | .0 | .0 | .0 | .0 | .0 | .0 | .0 | .0 | .0 | .0 |
| Account Receivables | 224.6 | 43.1 | 1,820.9 | 88.6 | 109.7 | 1,189.3 | 1,592.7 | 2,132.9 | 2,856.3 | 3,825.0 |
| Account Receivables, % | 4.53 | 0.61706 | 21.41 | 0.78693 | 0.69286 | 5.61 | 5.61 | 5.61 | 5.61 | 5.61 |
| Inventories | 272.7 | 340.0 | 394.2 | 568.6 | 1,068.1 | 1,136.9 | 1,522.5 | 2,038.8 | 2,730.3 | 3,656.4 |
| Inventories, % | 5.5 | 4.87 | 4.63 | 5.05 | 6.74 | 5.36 | 5.36 | 5.36 | 5.36 | 5.36 |
| Accounts Payable | 298.0 | 554.4 | 651.2 | 884.4 | 1,265.3 | 1,588.8 | 2,127.6 | 2,849.2 | 3,815.6 | 5,109.7 |
| Accounts Payable, % | 6.01 | 7.95 | 7.66 | 7.85 | 7.99 | 7.49 | 7.49 | 7.49 | 7.49 | 7.49 |
| Capital Expenditure | -645.4 | -609.5 | -792.7 | -917.7 | -1,687.5 | -2,115.7 | -2,833.2 | -3,794.1 | -5,081.0 | -6,804.3 |
| Capital Expenditure, % | -13.02 | -8.73 | -9.32 | -8.15 | -10.65 | -9.97 | -9.97 | -9.97 | -9.97 | -9.97 |
| Tax Rate, % | 19.01 | 19.01 | 19.01 | 19.01 | 19.01 | 19.01 | 19.01 | 19.01 | 19.01 | 19.01 |
| EBITAT | 789.7 | 1,070.9 | 1,381.1 | 1,863.6 | 3,061.6 | 3,534.8 | 4,733.7 | 6,339.2 | 8,489.2 | 11,368.4 |
| Depreciation | ||||||||||
| Changes in Account Receivables | ||||||||||
| Changes in Inventories | ||||||||||
| Changes in Accounts Payable | ||||||||||
| Capital Expenditure | ||||||||||
| UFCF | 76.6 | 1,014.1 | -926.3 | 2,986.6 | 1,570.1 | 1,111.4 | 2,342.9 | 3,137.5 | 4,201.7 | 5,626.7 |
| WACC, % | 4.81 | 4.81 | 4.81 | 4.81 | 4.81 | 4.81 | 4.81 | 4.81 | 4.81 | 4.81 |
| PV UFCF | ||||||||||
| SUM PV UFCF | 13,850.6 | |||||||||
| Long Term Growth Rate, % | 3.50 | |||||||||
| Free cash flow (T + 1) | 5,824 | |||||||||
| Terminal Value | 445,767 | |||||||||
| Present Terminal Value | 352,507 | |||||||||
| Enterprise Value | 366,358 | |||||||||
| Net Debt | 984 | |||||||||
| Equity Value | 365,373 | |||||||||
| Diluted Shares Outstanding, MM | 520 | |||||||||
| Equity Value Per Share | 702.63 |
What You Will Receive
- Accurate 605499SS Financials: Contains both historical data and projections for precise valuation.
- Customizable Inputs: Adjust parameters such as WACC, tax rates, revenue growth, and capital expenditures.
- Real-Time Calculations: Intrinsic value and NPV are automatically computed.
- Scenario Testing: Explore various scenarios to assess Eastroc Beverage's future performance.
- User-Friendly Design: Designed for professionals while remaining accessible for newcomers.
Key Features
- Comprehensive DCF Calculator: Offers detailed unlevered and levered DCF valuation models tailored for Eastroc Beverage (Group) Co.,Ltd. (605499SS).
- WACC Calculator: Ready-to-use Weighted Average Cost of Capital sheet with user-friendly customizable inputs.
- Editable Forecast Assumptions: Adjust growth rates, capital expenditures, and discount rates as needed.
- Integrated Financial Ratios: Assess profitability, leverage, and efficiency metrics specific to Eastroc Beverage (Group) Co.,Ltd. (605499SS).
- Visual Dashboard and Charts: Graphical outputs present essential valuation metrics for streamlined analysis.
How It Works
- Step 1: Download the Excel file.
- Step 2: Review Eastroc Beverage's pre-filled financial data and forecasts.
- Step 3: Adjust key inputs such as revenue growth, WACC, and tax rates (highlighted cells).
- Step 4: Observe the DCF model refresh instantly as you modify your assumptions.
- Step 5: Evaluate the outputs and leverage the results for your investment decisions.
Why Opt for This Calculator?
- All-in-One Solution: Offers DCF, WACC, and financial ratio analyses seamlessly integrated.
- Flexible Inputs: Modify the highlighted cells to explore different scenarios.
- In-Depth Analysis: Automatically computes Eastroc Beverage’s intrinsic value and Net Present Value.
- Loaded with Data: Features both historical and projected data for precise analysis.
- High Professional Standards: Perfect for financial analysts, investors, and business consultants.
Who Should Consider This Product?
- Individual Investors: Gain insights for informed decisions on purchasing or selling Eastroc Beverage (Group) Co., Ltd. (605499SS) stock.
- Financial Analysts: Enhance valuation practices with accessible financial models tailored for Eastroc Beverage (Group) Co., Ltd. (605499SS).
- Consultants: Provide clients with quick and precise valuation expertise regarding Eastroc Beverage (Group) Co., Ltd. (605499SS).
- Business Owners: Learn how large corporations like Eastroc Beverage (Group) Co., Ltd. (605499SS) are appraised to inform your own business strategies.
- Finance Students: Develop valuation skills using practical data and scenarios related to Eastroc Beverage (Group) Co., Ltd. (605499SS).
Contents of the Template
- Comprehensive DCF Model: Editable framework featuring in-depth valuation calculations.
- Real-World Data: Eastroc Beverage's (605499SS) historical and projected financial information preloaded for detailed analysis.
- Customizable Parameters: Modify WACC, growth rates, and tax assumptions to explore various scenarios.
- Financial Statements: Complete annual and quarterly breakdowns for enhanced insights.
- Key Ratios: Integrated analysis focusing on profitability, efficiency, and leverage metrics.
- Dashboard with Visual Outputs: Charts and tables designed for clear and actionable results.
Disclaimer
All information, articles, and product details provided on this website are for general informational and educational purposes only. We do not claim any ownership over, nor do we intend to infringe upon, any trademarks, copyrights, logos, brand names, or other intellectual property mentioned or depicted on this site. Such intellectual property remains the property of its respective owners, and any references here are made solely for identification or informational purposes, without implying any affiliation, endorsement, or partnership.
We make no representations or warranties, express or implied, regarding the accuracy, completeness, or suitability of any content or products presented. Nothing on this website should be construed as legal, tax, investment, financial, medical, or other professional advice. In addition, no part of this site—including articles or product references—constitutes a solicitation, recommendation, endorsement, advertisement, or offer to buy or sell any securities, franchises, or other financial instruments, particularly in jurisdictions where such activity would be unlawful.
All content is of a general nature and may not address the specific circumstances of any individual or entity. It is not a substitute for professional advice or services. Any actions you take based on the information provided here are strictly at your own risk. You accept full responsibility for any decisions or outcomes arising from your use of this website and agree to release us from any liability in connection with your use of, or reliance upon, the content or products found herein.