
|
China Tobacco International Company Limited (6055.HK) DCF -Bewertung |
Fully Editable: Tailor To Your Needs In Excel Or Sheets
Professional Design: Trusted, Industry-Standard Templates
Investor-Approved Valuation Models
MAC/PC Compatible, Fully Unlocked
No Expertise Is Needed; Easy To Follow
China Tobacco International (HK) Company Limited (6055.HK) Bundle
Bewerten Sie die finanziellen Aussichten von China Tobacco International (HK) Company Limited wie ein Experte! Dieser DCF-Taschenrechner (6055HK) bietet Ihnen vorgefüllte Finanzdaten und die Flexibilität, wichtige Annahmen wie Umsatzwachstum, WACC, Margen und mehr zu ändern, um sich an Ihren Projektionen anzupassen.
What You Will Receive
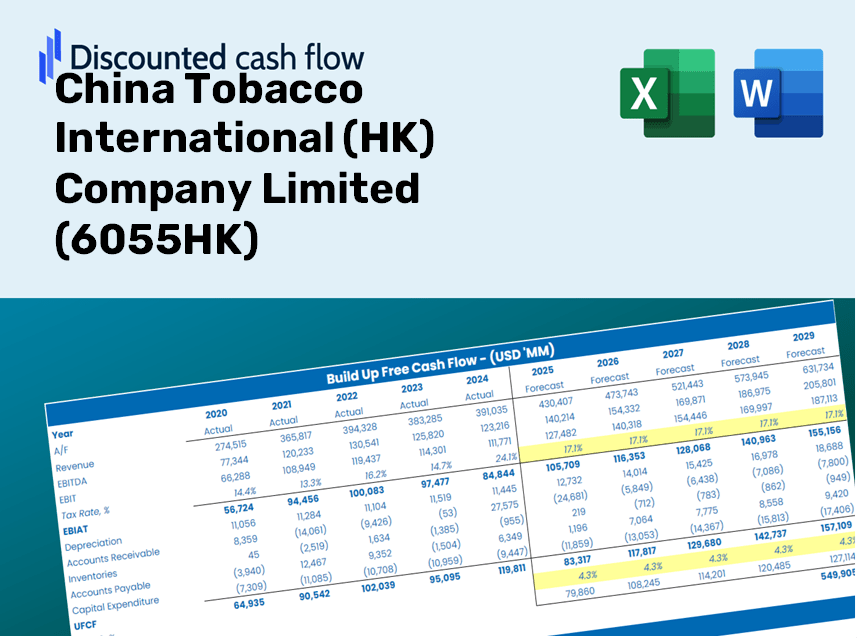
- Authentic Financial Data: Preloaded financial metrics – including revenue and EBIT – based on real and projected figures for China Tobacco International (HK) Company Limited (6055HK).
- Comprehensive Customization: Modify all key variables (highlighted cells) such as WACC, growth rates, and tax percentages.
- Immediate Valuation Insights: Automatic updates to recalibrate and assess the effects of changes on the fair value of China Tobacco International (HK) Company Limited (6055HK).
- Flexible Excel Template: Designed for quick modifications, scenario analyses, and in-depth forecasting.
- Efficient and Precise: Avoid the hassle of building models from the ground up while ensuring accuracy and adaptability.
Key Features
- Comprehensive Data Set: Access China Tobacco International's historical financial statements and pre-filled forecasts.
- Customizable Parameters: Adjust WACC, tax rates, revenue growth, and EBITDA margins to fit your analysis.
- Real-Time Calculations: Instantly view the intrinsic value of China Tobacco International (6055HK) as it updates live.
- Intuitive Visualizations: Dashboard charts present valuation results and essential metrics clearly.
- Precision Engineered: A reliable tool designed for analysts, investors, and financial professionals.
How It Works
- Download: Obtain the pre-configured Excel file containing financial data for China Tobacco International (HK) Company Limited (6055HK).
- Customize: Modify parameters such as revenue growth, EBITDA percentage, and WACC to fit your analysis.
- Update Automatically: Real-time updates for intrinsic value and NPV calculations as you adjust your inputs.
- Test Scenarios: Generate various projections and instantly compare the results.
- Make Decisions: Utilize the valuation insights to inform your investment choices.
Why Opt for This Calculator?
- All-in-One Solution: Integrates DCF, WACC, and financial ratio analyses in a single platform.
- Flexible Inputs: Modify the yellow-highlighted fields to explore different scenarios.
- In-Depth Analysis: Automatically computes the intrinsic value and Net Present Value for China Tobacco International (HK) Company Limited (6055HK).
- Preloaded Information: Historical and projected data provide accurate benchmarks.
- High-Quality Standards: Perfect for financial analysts, investors, and business consultants.
Who Can Benefit from This Product?
- Investors: Enhance your investment strategies with a professional-grade valuation tool tailored for (6055HK).
- Financial Analysts: Streamline your workflow with a customizable, pre-built DCF model specific to (6055HK).
- Consultants: Effortlessly modify the template for impactful client presentations or detailed reports on (6055HK).
- Finance Enthusiasts: Expand your knowledge of valuation techniques through practical, real-world examples from (6055HK).
- Educators and Students: Utilize this resource as an effective learning aid in finance courses focusing on (6055HK).
Overview of the Template Contents
- Preloaded CTI Data: Historical and forecasted financial metrics, encompassing revenue, EBIT, and capital expenditures.
- DCF and WACC Models: Professional templates designed for calculating intrinsic value and Weighted Average Cost of Capital.
- Customizable Inputs: Cells highlighted in yellow for modifying revenue growth, tax rates, and discount rates.
- Financial Statements: Detailed annual and quarterly financials for in-depth analysis.
- Key Ratios: Ratios focusing on profitability, leverage, and efficiency to assess performance.
- Dashboard and Charts: Visual representations of valuation results and underlying assumptions.
Disclaimer
All information, articles, and product details provided on this website are for general informational and educational purposes only. We do not claim any ownership over, nor do we intend to infringe upon, any trademarks, copyrights, logos, brand names, or other intellectual property mentioned or depicted on this site. Such intellectual property remains the property of its respective owners, and any references here are made solely for identification or informational purposes, without implying any affiliation, endorsement, or partnership.
We make no representations or warranties, express or implied, regarding the accuracy, completeness, or suitability of any content or products presented. Nothing on this website should be construed as legal, tax, investment, financial, medical, or other professional advice. In addition, no part of this site—including articles or product references—constitutes a solicitation, recommendation, endorsement, advertisement, or offer to buy or sell any securities, franchises, or other financial instruments, particularly in jurisdictions where such activity would be unlawful.
All content is of a general nature and may not address the specific circumstances of any individual or entity. It is not a substitute for professional advice or services. Any actions you take based on the information provided here are strictly at your own risk. You accept full responsibility for any decisions or outcomes arising from your use of this website and agree to release us from any liability in connection with your use of, or reliance upon, the content or products found herein.