
|
CSC Financial Co., Ltd. (6066.HK) DCF -Bewertung |
Fully Editable: Tailor To Your Needs In Excel Or Sheets
Professional Design: Trusted, Industry-Standard Templates
Investor-Approved Valuation Models
MAC/PC Compatible, Fully Unlocked
No Expertise Is Needed; Easy To Follow
CSC Financial Co., Ltd. (6066.HK) Bundle
Entdecken Sie den wahren Wert von CSC Financial Co., Ltd. (6066HK) mit unserem fortschrittlichen DCF -Taschenrechner! Passen Sie kritische Annahmen an, erkunden Sie verschiedene Szenarien und bewerten Sie, wie sich verschiedene Faktoren auswirken, wie sich die Bewertung von CSC Financial Co., Ltd. (6066HK) auswirkt-alles innerhalb einer einfach zu verwendenden Excel-Vorlage.
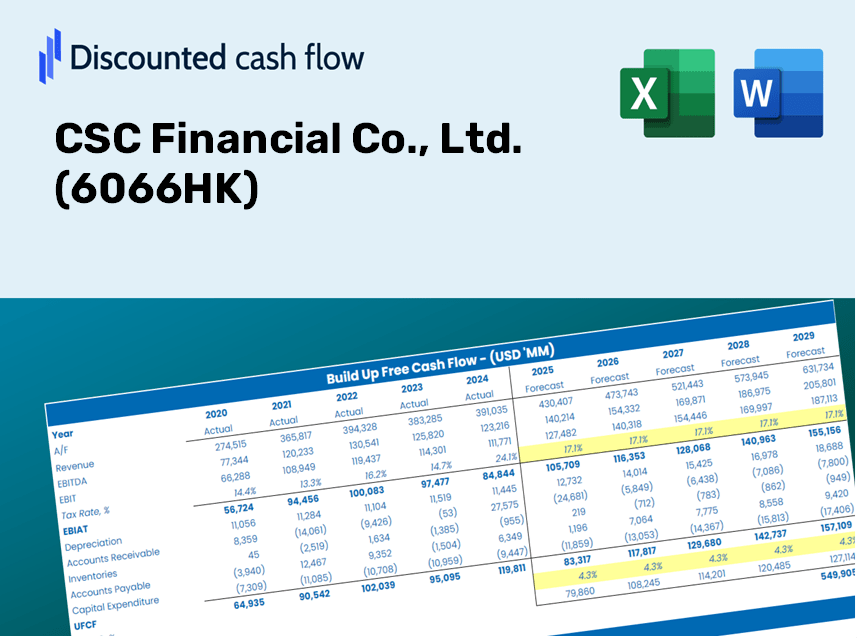
Discounted Cash Flow (DCF) - (USD MM)
| Year | AY1 2020 |
AY2 2021 |
AY3 2022 |
AY4 2023 |
AY5 2024 |
FY1 2025 |
FY2 2026 |
FY3 2027 |
FY4 2028 |
FY5 2029 |
|---|---|---|---|---|---|---|---|---|---|---|
| Revenue | 32,540.4 | 41,028.0 | 31,793.8 | 30,655.3 | 33,753.6 | 34,606.1 | 35,480.1 | 36,376.2 | 37,294.9 | 38,236.8 |
| Revenue Growth, % | 0 | 26.08 | -22.51 | -3.58 | 10.11 | 2.53 | 2.53 | 2.53 | 2.53 | 2.53 |
| EBITDA | 20,285.3 | 22,975.0 | 19,282.0 | 19,597.2 | 19,515.3 | 20,814.1 | 21,339.8 | 21,878.7 | 22,431.3 | 22,997.8 |
| EBITDA, % | 62.34 | 56 | 60.65 | 63.93 | 57.82 | 60.15 | 60.15 | 60.15 | 60.15 | 60.15 |
| Depreciation | 704.7 | 816.7 | 1,106.6 | 1,242.7 | 1,369.4 | 1,089.9 | 1,117.4 | 1,145.7 | 1,174.6 | 1,204.3 |
| Depreciation, % | 2.17 | 1.99 | 3.48 | 4.05 | 4.06 | 3.15 | 3.15 | 3.15 | 3.15 | 3.15 |
| EBIT | 19,580.6 | 22,158.3 | 18,175.4 | 18,354.5 | 18,146.0 | 19,724.2 | 20,222.4 | 20,733.1 | 21,256.7 | 21,793.6 |
| EBIT, % | 60.17 | 54.01 | 57.17 | 59.87 | 53.76 | 57 | 57 | 57 | 57 | 57 |
| Total Cash | 168,586.2 | 280,689.3 | 226,016.4 | 31,710.3 | 358,694.2 | 34,606.1 | 35,480.1 | 36,376.2 | 37,294.9 | 38,236.8 |
| Total Cash, percent | .0 | .0 | .0 | .0 | .0 | .0 | .0 | .0 | .0 | .0 |
| Account Receivables | 8,771.6 | 25,374.2 | 11,842.9 | 10,589.9 | 9,998.6 | 13,165.5 | 13,498.0 | 13,838.9 | 14,188.4 | 14,546.7 |
| Account Receivables, % | 26.96 | 61.85 | 37.25 | 34.55 | 29.62 | 38.04 | 38.04 | 38.04 | 38.04 | 38.04 |
| Inventories | .0 | 51.5 | 56.3 | .0 | .0 | 20.9 | 21.5 | 22.0 | 22.6 | 23.1 |
| Inventories, % | 0 | 0.1255 | 0.177 | 0 | 0 | 0.06050068 | 0.06050068 | 0.06050068 | 0.06050068 | 0.06050068 |
| Accounts Payable | 86,858.9 | 119,268.9 | 144,097.5 | 135,698.4 | 164,211.0 | 34,606.1 | 35,480.1 | 36,376.2 | 37,294.9 | 38,236.8 |
| Accounts Payable, % | 266.93 | 290.7 | 453.23 | 442.66 | 486.5 | 100 | 100 | 100 | 100 | 100 |
| Capital Expenditure | -473.4 | -678.7 | -598.3 | -1,179.0 | -589.5 | -732.5 | -751.0 | -770.0 | -789.4 | -809.4 |
| Capital Expenditure, % | -1.45 | -1.65 | -1.88 | -3.85 | -1.75 | -2.12 | -2.12 | -2.12 | -2.12 | -2.12 |
| Tax Rate, % | 16.88 | 16.88 | 16.88 | 16.88 | 16.88 | 16.88 | 16.88 | 16.88 | 16.88 | 16.88 |
| EBITAT | 15,355.8 | 17,423.8 | 14,428.4 | 15,422.6 | 15,082.7 | 15,920.8 | 16,322.9 | 16,735.2 | 17,157.8 | 17,591.2 |
| Depreciation | ||||||||||
| Changes in Account Receivables | ||||||||||
| Changes in Inventories | ||||||||||
| Changes in Accounts Payable | ||||||||||
| Capital Expenditure | ||||||||||
| UFCF | 93,674.3 | 33,317.8 | 53,291.8 | 8,396.4 | 44,966.5 | -116,514.4 | 17,230.3 | 17,665.5 | 18,111.6 | 18,569.0 |
| WACC, % | 4.58 | 4.58 | 4.6 | 4.74 | 4.72 | 4.64 | 4.64 | 4.64 | 4.64 | 4.64 |
| PV UFCF | ||||||||||
| SUM PV UFCF | -50,290.3 | |||||||||
| Long Term Growth Rate, % | 2.00 | |||||||||
| Free cash flow (T + 1) | 18,940 | |||||||||
| Terminal Value | 716,145 | |||||||||
| Present Terminal Value | 570,707 | |||||||||
| Enterprise Value | 520,416 | |||||||||
| Net Debt | 134,281 | |||||||||
| Equity Value | 386,135 | |||||||||
| Diluted Shares Outstanding, MM | 7,757 | |||||||||
| Equity Value Per Share | 49.78 |
What You Will Receive
- Authentic CSC Financial Data: Pre-populated with historical and projected financial information for thorough analysis.
- Completely Customizable Template: Easily adjust essential inputs such as revenue growth, WACC, and EBITDA margin.
- Instantaneous Calculations: Witness the intrinsic value of CSC Financial Co., Ltd. (6066HK) update in real-time as you make modifications.
- Expert Valuation Tool: Tailored for investors, analysts, and consultants aiming for precise DCF outcomes.
- Intuitive Layout: User-friendly structure and straightforward guidelines suitable for all proficiency levels.
Key Features
- Customizable Financial Inputs: Adjust essential metrics such as revenue growth rate, EBITDA percentage, and capital expenditures for accurate forecasting.
- Instant DCF Valuation: Automatically computes intrinsic value, net present value (NPV), and other financial metrics in real-time.
- High-Precision Accuracy: Utilizes CSC Financial Co., Ltd. (6066HK) real-world data to deliver realistic valuation results.
- Effortless Scenario Testing: Easily explore various assumptions and analyze the resulting outcomes without hassle.
- Efficiency Booster: Streamline the valuation process by eliminating the need for complex model construction from the ground up.
How It Works
- Step 1: Download the Excel file.
- Step 2: Examine CSC Financial Co., Ltd.'s [6066HK] pre-filled financial data and projections.
- Step 3: Adjust key inputs such as revenue growth, WACC, and tax rates (highlighted cells).
- Step 4: Observe the DCF model update in real-time as you modify your assumptions.
- Step 5: Review the outputs and leverage the findings for your investment strategies.
Why Opt for This Calculator?
- User-Friendly Interface: Perfectly tailored for both novices and seasoned professionals.
- Customizable Parameters: Effortlessly adjust inputs to align with your financial analysis.
- Real-Time Insights: Observe immediate updates to CSC Financial Co., Ltd.'s valuation as you modify inputs.
- Pre-Configured: Comes pre-loaded with CSC Financial Co., Ltd.'s actual financial data for swift analyses.
- Preferred by Experts: Endorsed by investors and analysts for making well-informed decisions.
Who Can Benefit from CSC Financial Co., Ltd. (6066HK)?
- Finance Students: Acquire hands-on experience with valuation methods and apply them to real-world data.
- Academics: Integrate advanced financial models into your teaching or research initiatives.
- Investors: Validate your investment hypotheses and evaluate valuation projections for CSC Financial Co., Ltd. (6066HK).
- Analysts: Enhance your efficiency with a tailored, ready-to-use DCF model.
- Small Business Owners: Understand the analytical processes used to evaluate large public firms like CSC Financial Co., Ltd. (6066HK).
What the Template Contains
- Historical Data: Contains CSC Financial Co., Ltd.'s (6066HK) previous financials and baseline forecasts.
- DCF and Levered DCF Models: Comprehensive templates for assessing the intrinsic value of CSC Financial Co., Ltd. (6066HK).
- WACC Sheet: Pre-configured calculations for Weighted Average Cost of Capital.
- Editable Inputs: Customize essential drivers such as growth rates, EBITDA percentages, and CAPEX assumptions.
- Quarterly and Annual Statements: An in-depth analysis of CSC Financial Co., Ltd.'s (6066HK) financials.
- Interactive Dashboard: Dynamically visualize valuation results and forecasts.
Disclaimer
All information, articles, and product details provided on this website are for general informational and educational purposes only. We do not claim any ownership over, nor do we intend to infringe upon, any trademarks, copyrights, logos, brand names, or other intellectual property mentioned or depicted on this site. Such intellectual property remains the property of its respective owners, and any references here are made solely for identification or informational purposes, without implying any affiliation, endorsement, or partnership.
We make no representations or warranties, express or implied, regarding the accuracy, completeness, or suitability of any content or products presented. Nothing on this website should be construed as legal, tax, investment, financial, medical, or other professional advice. In addition, no part of this site—including articles or product references—constitutes a solicitation, recommendation, endorsement, advertisement, or offer to buy or sell any securities, franchises, or other financial instruments, particularly in jurisdictions where such activity would be unlawful.
All content is of a general nature and may not address the specific circumstances of any individual or entity. It is not a substitute for professional advice or services. Any actions you take based on the information provided here are strictly at your own risk. You accept full responsibility for any decisions or outcomes arising from your use of this website and agree to release us from any liability in connection with your use of, or reliance upon, the content or products found herein.