
|
Sy Holdings Group Limited (6069.HK) DCF -Bewertung |
Fully Editable: Tailor To Your Needs In Excel Or Sheets
Professional Design: Trusted, Industry-Standard Templates
Investor-Approved Valuation Models
MAC/PC Compatible, Fully Unlocked
No Expertise Is Needed; Easy To Follow
SY Holdings Group Limited (6069.HK) Bundle
Möchten Sie den inneren Wert der Sy Holdings Group Limited bestimmen? Unser (6069HK) DCF-Taschenrechner integriert reale Daten zusammen mit umfangreichen Anpassungsoptionen, sodass Sie Prognosen anpassen und Ihre Investitionsentscheidungen verbessern können.
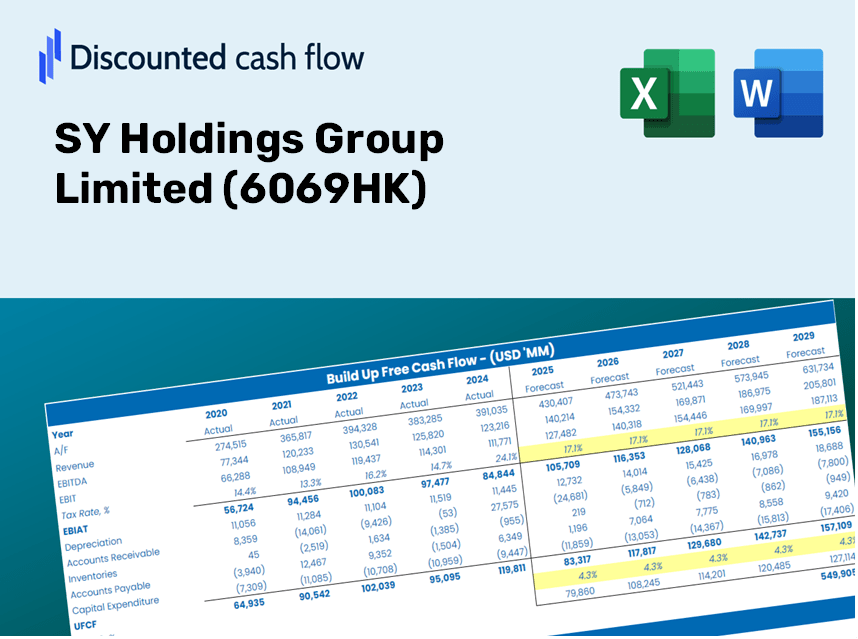
Discounted Cash Flow (DCF) - (USD MM)
| Year | AY1 2020 |
AY2 2021 |
AY3 2022 |
AY4 2023 |
AY5 2024 |
FY1 2025 |
FY2 2026 |
FY3 2027 |
FY4 2028 |
FY5 2029 |
|---|---|---|---|---|---|---|---|---|---|---|
| Revenue | 692.7 | 524.5 | 874.4 | 1,052.6 | 1,004.3 | 1,150.5 | 1,317.9 | 1,509.7 | 1,729.4 | 1,981.1 |
| Revenue Growth, % | 0 | -24.28 | 66.7 | 20.38 | -4.58 | 14.55 | 14.55 | 14.55 | 14.55 | 14.55 |
| EBITDA | 580.6 | 359.2 | 645.6 | 885.9 | 707.4 | 876.1 | 1,003.5 | 1,149.6 | 1,316.9 | 1,508.5 |
| EBITDA, % | 83.82 | 68.47 | 73.83 | 84.17 | 70.44 | 76.15 | 76.15 | 76.15 | 76.15 | 76.15 |
| Depreciation | 19.4 | 3.6 | 31.3 | 34.4 | 24.0 | 29.2 | 33.5 | 38.4 | 44.0 | 50.4 |
| Depreciation, % | 2.79 | 0.67976 | 3.58 | 3.27 | 2.39 | 2.54 | 2.54 | 2.54 | 2.54 | 2.54 |
| EBIT | 561.3 | 355.6 | 614.3 | 851.5 | 683.5 | 846.8 | 970.0 | 1,111.2 | 1,272.9 | 1,458.2 |
| EBIT, % | 81.03 | 67.79 | 70.26 | 80.9 | 68.05 | 73.6 | 73.6 | 73.6 | 73.6 | 73.6 |
| Total Cash | 4,554.9 | 8,251.1 | 9,860.3 | 9,334.2 | 6,275.5 | 1,150.5 | 1,317.9 | 1,509.7 | 1,729.4 | 1,981.1 |
| Total Cash, percent | .0 | .0 | .0 | .0 | .0 | .0 | .0 | .0 | .0 | .0 |
| Account Receivables | 4,161.8 | 7,197.5 | 8,990.0 | 209.5 | 385.1 | 824.3 | 944.3 | 1,081.7 | 1,239.1 | 1,419.5 |
| Account Receivables, % | 600.79 | 1372.15 | 1028.13 | 19.9 | 38.34 | 71.65 | 71.65 | 71.65 | 71.65 | 71.65 |
| Inventories | .0 | -207.8 | -279.9 | -220.7 | .0 | -213.1 | -244.1 | -279.6 | -320.3 | -366.9 |
| Inventories, % | 0 | -39.62 | -32.02 | -20.97 | 0 | -18.52 | -18.52 | -18.52 | -18.52 | -18.52 |
| Accounts Payable | .0 | .0 | 4.9 | 6.5 | 3.1 | 3.4 | 3.9 | 4.5 | 5.1 | 5.9 |
| Accounts Payable, % | 0 | 0 | 0.56083 | 0.61535 | 0.30391 | 0.29602 | 0.29602 | 0.29602 | 0.29602 | 0.29602 |
| Capital Expenditure | -13.0 | -36.9 | -124.8 | -67.5 | -82.1 | -86.9 | -99.6 | -114.0 | -130.6 | -149.7 |
| Capital Expenditure, % | -1.87 | -7.04 | -14.27 | -6.41 | -8.17 | -7.55 | -7.55 | -7.55 | -7.55 | -7.55 |
| Tax Rate, % | 26.91 | 26.91 | 26.91 | 26.91 | 26.91 | 26.91 | 26.91 | 26.91 | 26.91 | 26.91 |
| EBITAT | 477.4 | 316.3 | 471.3 | 616.2 | 499.6 | 671.0 | 768.6 | 880.5 | 1,008.6 | 1,155.4 |
| Depreciation | ||||||||||
| Changes in Account Receivables | ||||||||||
| Changes in Inventories | ||||||||||
| Changes in Accounts Payable | ||||||||||
| Capital Expenditure | ||||||||||
| UFCF | -3,678.0 | -2,545.0 | -1,337.7 | 9,306.0 | 41.7 | 387.5 | 614.1 | 703.5 | 805.9 | 923.1 |
| WACC, % | 4.42 | 4.47 | 4.31 | 4.25 | 4.26 | 4.34 | 4.34 | 4.34 | 4.34 | 4.34 |
| PV UFCF | ||||||||||
| SUM PV UFCF | 2,980.8 | |||||||||
| Long Term Growth Rate, % | 2.00 | |||||||||
| Free cash flow (T + 1) | 942 | |||||||||
| Terminal Value | 40,179 | |||||||||
| Present Terminal Value | 32,484 | |||||||||
| Enterprise Value | 35,465 | |||||||||
| Net Debt | 5,059 | |||||||||
| Equity Value | 30,405 | |||||||||
| Diluted Shares Outstanding, MM | 977 | |||||||||
| Equity Value Per Share | 31.13 |
What You Will Receive
- Flexible Forecast Inputs: Seamlessly modify key assumptions (growth %, profit margins, WACC) to generate various scenarios.
- Comprehensive Data: SY Holdings Group Limited's (6069HK) financial data pre-loaded to facilitate your analysis.
- Automated DCF Outputs: The template calculates Net Present Value (NPV) and intrinsic value automatically for your convenience.
- Customizable and Professional Design: A refined Excel model that caters to your valuation requirements.
- Designed for Analysts and Investors: Perfect for evaluating projections, affirming strategies, and optimizing time efficiency.
Key Features
- Pre-Loaded Data: Historical financial statements and pre-filled forecasts for SY Holdings Group Limited (6069HK).
- Fully Adjustable Inputs: Customize WACC, tax rates, revenue growth, and EBITDA margins as needed.
- Instant Results: View the intrinsic value of SY Holdings Group Limited (6069HK) recalculated in real time.
- Clear Visual Outputs: Dashboard charts present valuation results and essential metrics clearly.
- Built for Accuracy: A professional-grade tool tailored for analysts, investors, and finance professionals.
How It Functions
- Download the Template: Gain immediate access to the Excel-based SY Holdings Group Limited (6069HK) DCF Calculator.
- Enter Your Assumptions: Modify the yellow-highlighted cells for growth rates, WACC, margins, and other variables.
- Automatic Calculations: The model instantly updates the intrinsic value of SY Holdings Group Limited (6069HK).
- Explore Scenarios: Test various assumptions to assess potential changes in valuation.
- Evaluate and Decide: Utilize the outcomes to inform your investment or financial analysis.
Why Opt for This Calculator?
- All-in-One Solution: Features DCF, WACC, and financial ratio analyses seamlessly integrated.
- Adjustable Parameters: Modify the yellow-highlighted fields to explore different scenarios.
- In-depth Analysis: Automatically computes the intrinsic value and Net Present Value for SY Holdings Group Limited (6069HK).
- Pre-Loaded Information: Comes with historical and forecasted data to provide reliable baselines.
- High-Caliber Tool: Perfect for financial analysts, investors, and business consultants.
Who Can Benefit from SY Holdings Group Limited (6069HK)?
- Institutional Investors: Develop comprehensive and trustworthy valuation models for investment evaluations.
- Corporate Finance Departments: Assess valuation scenarios to inform strategic decisions within the organization.
- Financial Consultants and Advisors: Deliver precise valuation insights for clients interested in SY Holdings Group Limited (6069HK).
- Academics and Students: Leverage real market data for practical exercises and educational purposes in financial modeling.
- Market Analysts: Gain insights into how companies like SY Holdings Group Limited (6069HK) are valued within the industry.
Overview of Template Features
- Operating and Balance Sheet Data: Pre-loaded historical data and forecasts for SY Holdings Group Limited (6069HK), including metrics such as revenue, EBITDA, EBIT, and capital expenditures.
- WACC Calculation: A dedicated worksheet for calculating the Weighted Average Cost of Capital (WACC), featuring key parameters like Beta, risk-free rate, and share price.
- DCF Valuation (Unlevered and Levered): Customizable Discounted Cash Flow models displaying intrinsic value with comprehensive calculations.
- Financial Statements: Pre-populated annual and quarterly financial statements to aid in analysis.
- Key Ratios: Includes various profitability, leverage, and efficiency ratios relevant to SY Holdings Group Limited (6069HK).
- Dashboard and Charts: Visual representations of valuation outputs and underlying assumptions for straightforward result analysis.
Disclaimer
All information, articles, and product details provided on this website are for general informational and educational purposes only. We do not claim any ownership over, nor do we intend to infringe upon, any trademarks, copyrights, logos, brand names, or other intellectual property mentioned or depicted on this site. Such intellectual property remains the property of its respective owners, and any references here are made solely for identification or informational purposes, without implying any affiliation, endorsement, or partnership.
We make no representations or warranties, express or implied, regarding the accuracy, completeness, or suitability of any content or products presented. Nothing on this website should be construed as legal, tax, investment, financial, medical, or other professional advice. In addition, no part of this site—including articles or product references—constitutes a solicitation, recommendation, endorsement, advertisement, or offer to buy or sell any securities, franchises, or other financial instruments, particularly in jurisdictions where such activity would be unlawful.
All content is of a general nature and may not address the specific circumstances of any individual or entity. It is not a substitute for professional advice or services. Any actions you take based on the information provided here are strictly at your own risk. You accept full responsibility for any decisions or outcomes arising from your use of this website and agree to release us from any liability in connection with your use of, or reliance upon, the content or products found herein.