
|
Everbright Securities Company Limited (6178.HK) DCF -Bewertung |
Fully Editable: Tailor To Your Needs In Excel Or Sheets
Professional Design: Trusted, Industry-Standard Templates
Investor-Approved Valuation Models
MAC/PC Compatible, Fully Unlocked
No Expertise Is Needed; Easy To Follow
Everbright Securities Company Limited (6178.HK) Bundle
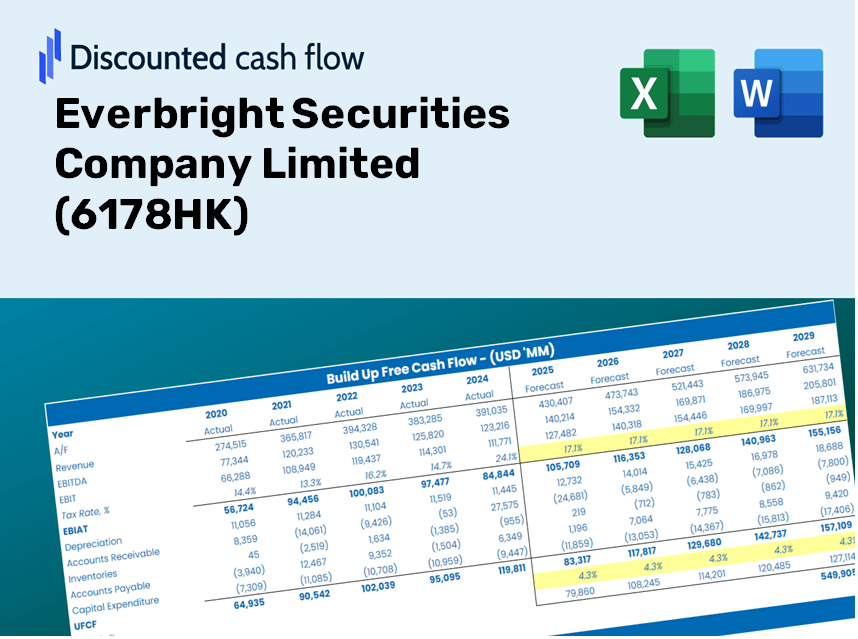
Erwerben Sie die Bewertungsanalyse für Ihre Everbright Securities Company Limited (6178HK) mit unserem ausgefeilten DCF -Taschenrechner! Diese Excel -Vorlage mit authentischen (6178HK-) Daten ermöglicht es, Prognosen und Annahmen anzupassen, um den inneren Wert von Everbright Securities Company Limited genau zu bestimmen.
Discounted Cash Flow (DCF) - (USD MM)
| Year | AY1 2020 |
AY2 2021 |
AY3 2022 |
AY4 2023 |
AY5 2024 |
FY1 2025 |
FY2 2026 |
FY3 2027 |
FY4 2028 |
FY5 2029 |
|---|---|---|---|---|---|---|---|---|---|---|
| Revenue | 17,234.6 | 22,263.5 | 15,210.3 | 10,851.2 | 10,359.8 | 9,435.4 | 8,593.6 | 7,826.8 | 7,128.5 | 6,492.5 |
| Revenue Growth, % | 0 | 29.18 | -31.68 | -28.66 | -4.53 | -8.92 | -8.92 | -8.92 | -8.92 | -8.92 |
| EBITDA | .0 | .0 | .0 | .0 | .0 | .0 | .0 | .0 | .0 | .0 |
| EBITDA, % | 0 | 0 | 0 | 0 | 0 | 0 | 0 | 0 | 0 | 0 |
| Depreciation | 721.0 | 593.6 | 642.5 | 707.4 | 693.7 | 458.3 | 417.5 | 380.2 | 346.3 | 315.4 |
| Depreciation, % | 4.18 | 2.67 | 4.22 | 6.52 | 6.7 | 4.86 | 4.86 | 4.86 | 4.86 | 4.86 |
| EBIT | -721.0 | -593.6 | -642.5 | -707.4 | -693.7 | -458.3 | -417.5 | -380.2 | -346.3 | -315.4 |
| EBIT, % | -4.18 | -2.67 | -4.22 | -6.52 | -6.7 | -4.86 | -4.86 | -4.86 | -4.86 | -4.86 |
| Total Cash | 135,690.8 | 145,798.7 | 135,018.5 | 127,326.4 | 149,788.8 | 9,435.4 | 8,593.6 | 7,826.8 | 7,128.5 | 6,492.5 |
| Total Cash, percent | .0 | .0 | .0 | .0 | .0 | .0 | .0 | .0 | .0 | .0 |
| Account Receivables | 3,113.9 | 2,118.3 | 1,584.5 | 1,316.1 | 1,258.8 | 1,175.3 | 1,070.4 | 974.9 | 887.9 | 808.7 |
| Account Receivables, % | 18.07 | 9.51 | 10.42 | 12.13 | 12.15 | 12.46 | 12.46 | 12.46 | 12.46 | 12.46 |
| Inventories | .0 | .0 | .0 | .0 | .0 | .0 | .0 | .0 | .0 | .0 |
| Inventories, % | 0 | 0 | 0 | 0 | 0 | 0 | 0 | 0 | 0 | 0 |
| Accounts Payable | 1,619.3 | 957.6 | 1,341.9 | 904.6 | 927.2 | 751.2 | 684.2 | 623.1 | 567.5 | 516.9 |
| Accounts Payable, % | 9.4 | 4.3 | 8.82 | 8.34 | 8.95 | 7.96 | 7.96 | 7.96 | 7.96 | 7.96 |
| Capital Expenditure | -386.4 | -330.4 | -313.0 | -552.8 | -406.4 | -279.3 | -254.4 | -231.7 | -211.0 | -192.2 |
| Capital Expenditure, % | -2.24 | -1.48 | -2.06 | -5.09 | -3.92 | -2.96 | -2.96 | -2.96 | -2.96 | -2.96 |
| Tax Rate, % | 14.59 | 14.59 | 14.59 | 14.59 | 14.59 | 14.59 | 14.59 | 14.59 | 14.59 | 14.59 |
| EBITAT | -420.8 | -443.0 | -531.7 | -635.1 | -592.5 | -358.4 | -326.4 | -297.3 | -270.8 | -246.6 |
| Depreciation | ||||||||||
| Changes in Account Receivables | ||||||||||
| Changes in Inventories | ||||||||||
| Changes in Accounts Payable | ||||||||||
| Capital Expenditure | ||||||||||
| UFCF | -1,580.9 | 154.2 | 716.0 | -649.5 | -225.3 | -271.8 | -125.5 | -114.3 | -104.1 | -94.8 |
| WACC, % | 6.11 | 6.67 | 6.96 | 7.2 | 7.05 | 6.8 | 6.8 | 6.8 | 6.8 | 6.8 |
| PV UFCF | ||||||||||
| SUM PV UFCF | -606.7 | |||||||||
| Long Term Growth Rate, % | 2.00 | |||||||||
| Free cash flow (T + 1) | -97 | |||||||||
| Terminal Value | -2,016 | |||||||||
| Present Terminal Value | -1,451 | |||||||||
| Enterprise Value | -2,057 | |||||||||
| Net Debt | 11,038 | |||||||||
| Equity Value | -13,095 | |||||||||
| Diluted Shares Outstanding, MM | 5,447 | |||||||||
| Equity Value Per Share | -2.40 |
What You Will Gain
- Authentic Everbright Data: Comprehensive financials – from revenue to EBIT – derived from real and forecasted figures.
- Complete Customization: Modify all essential parameters (yellow cells) such as WACC, growth %, and tax rates.
- Immediate Valuation Adjustments: Automatic recalculations to assess the effect of changes on Everbright's fair value.
- Flexible Excel Template: Designed for quick modifications, scenario analysis, and thorough projections.
- Efficient and Precise: Bypass building models from the ground up while ensuring accuracy and adaptability.
Key Features
- Comprehensive DCF Calculator: Contains thorough unlevered and levered DCF valuation models tailored for Everbright Securities Company Limited (6178HK).
- WACC Calculator: Features a pre-configured Weighted Average Cost of Capital sheet with adjustable parameters.
- Customizable Forecast Assumptions: Easily update growth rates, capital expenditures, and discount rates.
- Integrated Financial Ratios: Evaluate profitability, leverage, and efficiency ratios specific to Everbright Securities Company Limited (6178HK).
- Interactive Dashboard and Charts: Visual representations highlight essential valuation metrics for straightforward analysis.
How It Functions
- Step 1: Download the Excel spreadsheet.
- Step 2: Examine the pre-filled Everbright Securities Company Limited (6178HK) data (historical and projected).
- Step 3: Modify key assumptions (highlighted in yellow) according to your insights.
- Step 4: Observe automatic recalculations for Everbright Securities Company Limited’s intrinsic value.
- Step 5: Utilize the results for investment choices or reporting purposes.
Why Choose This Calculator for Everbright Securities (6178HK)?
- Designed for Experts: A sophisticated tool favored by analysts, CFOs, and financial consultants.
- Comprehensive Data: Everbright Securities’ historical and forecasted financials are included for precision.
- Scenario Analysis: Effortlessly test various projections and assumptions.
- Insightful Outputs: Instantly computes intrinsic value, NPV, and essential financial metrics.
- User-Friendly: Detailed, step-by-step guidance facilitates a smooth experience.
Who Would Benefit from This Product?
- Investors: Assess the fair value of Everbright Securities Company Limited (6178HK) before making investment choices.
- CFOs: Utilize a high-quality DCF model for accurate financial reporting and analysis.
- Consultants: Easily modify the template for client valuation reports.
- Entrepreneurs: Discover financial modeling practices employed by leading firms.
- Educators: Employ this resource as a teaching aid to illustrate valuation techniques.
Contents of the Template
- Pre-Filled Data: Contains Everbright Securities Company Limited’s historical financial data and projections.
- Discounted Cash Flow Model: An editable DCF valuation model with automatic calculation features.
- Weighted Average Cost of Capital (WACC): A dedicated worksheet for WACC calculations based on user-defined inputs.
- Key Financial Ratios: Evaluate Everbright Securities' profitability, efficiency, and leverage ratios.
- Customizable Inputs: Easily modify revenue growth, profit margins, and tax rates.
- Clear Dashboard: Visualizations and tables that summarize essential valuation outcomes.
Disclaimer
All information, articles, and product details provided on this website are for general informational and educational purposes only. We do not claim any ownership over, nor do we intend to infringe upon, any trademarks, copyrights, logos, brand names, or other intellectual property mentioned or depicted on this site. Such intellectual property remains the property of its respective owners, and any references here are made solely for identification or informational purposes, without implying any affiliation, endorsement, or partnership.
We make no representations or warranties, express or implied, regarding the accuracy, completeness, or suitability of any content or products presented. Nothing on this website should be construed as legal, tax, investment, financial, medical, or other professional advice. In addition, no part of this site—including articles or product references—constitutes a solicitation, recommendation, endorsement, advertisement, or offer to buy or sell any securities, franchises, or other financial instruments, particularly in jurisdictions where such activity would be unlawful.
All content is of a general nature and may not address the specific circumstances of any individual or entity. It is not a substitute for professional advice or services. Any actions you take based on the information provided here are strictly at your own risk. You accept full responsibility for any decisions or outcomes arising from your use of this website and agree to release us from any liability in connection with your use of, or reliance upon, the content or products found herein.