
|
Qingdao Port International Co., Ltd. (6198.HK) DCF -Bewertung |
Fully Editable: Tailor To Your Needs In Excel Or Sheets
Professional Design: Trusted, Industry-Standard Templates
Investor-Approved Valuation Models
MAC/PC Compatible, Fully Unlocked
No Expertise Is Needed; Easy To Follow
Qingdao Port International Co., Ltd. (6198.HK) Bundle
Entdecken Sie das wahre Potenzial von Qingdao Port International Co., Ltd. (6198HK) mit unserem fortschrittlichen DCF -Taschenrechner! Passen Sie die wichtigsten Annahmen an, erkunden Sie verschiedene Szenarien und untersuchen, wie sich Änderungen auf die Bewertung von Qingdao Port International Co., Ltd. (6198HK) auswirken - alles innerhalb einer einzigen Excel -Vorlage.
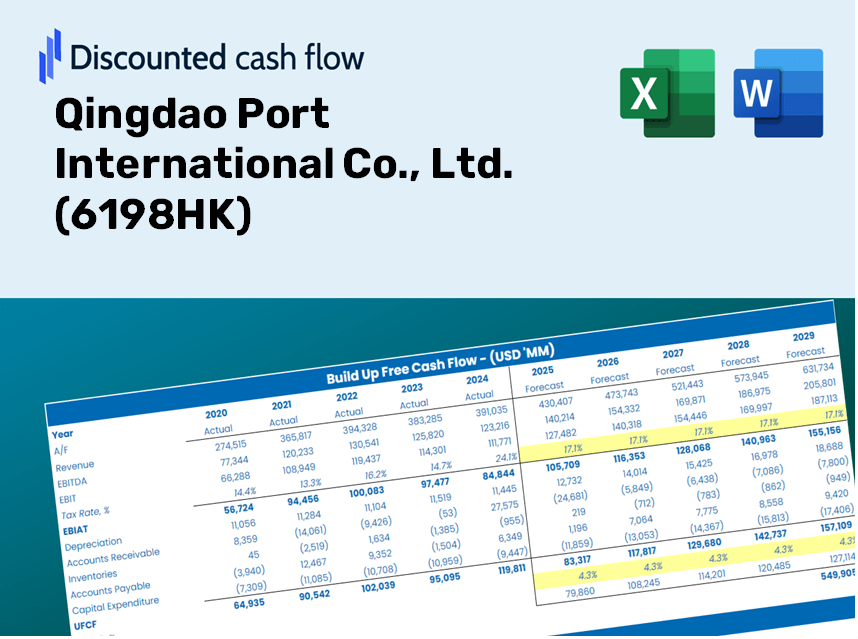
Discounted Cash Flow (DCF) - (USD MM)
| Year | AY1 2020 |
AY2 2021 |
AY3 2022 |
AY4 2023 |
AY5 2024 |
FY1 2025 |
FY2 2026 |
FY3 2027 |
FY4 2028 |
FY5 2029 |
|---|---|---|---|---|---|---|---|---|---|---|
| Revenue | 14,483.9 | 18,398.9 | 21,105.3 | 19,911.4 | 20,752.7 | 22,844.0 | 25,146.0 | 27,680.0 | 30,469.3 | 33,539.7 |
| Revenue Growth, % | 0 | 27.03 | 14.71 | -5.66 | 4.23 | 10.08 | 10.08 | 10.08 | 10.08 | 10.08 |
| EBITDA | 7,292.7 | 7,843.8 | 8,780.5 | 9,186.3 | 7,335.7 | 9,871.8 | 10,866.6 | 11,961.6 | 13,167.0 | 14,493.9 |
| EBITDA, % | 50.35 | 42.63 | 41.6 | 46.14 | 35.35 | 43.21 | 43.21 | 43.21 | 43.21 | 43.21 |
| Depreciation | 1,009.9 | 1,257.2 | 1,428.4 | 1,569.9 | 1,392.0 | 1,606.7 | 1,768.6 | 1,946.8 | 2,143.0 | 2,358.9 |
| Depreciation, % | 6.97 | 6.83 | 6.77 | 7.88 | 6.71 | 7.03 | 7.03 | 7.03 | 7.03 | 7.03 |
| EBIT | 6,282.8 | 6,586.6 | 7,352.1 | 7,616.4 | 5,943.7 | 8,265.2 | 9,098.0 | 10,014.9 | 11,024.1 | 12,135.0 |
| EBIT, % | 43.38 | 35.8 | 34.84 | 38.25 | 28.64 | 36.18 | 36.18 | 36.18 | 36.18 | 36.18 |
| Total Cash | 12,780.7 | 10,969.7 | 11,149.1 | 12,291.7 | 13,894.1 | 15,048.3 | 16,564.7 | 18,234.0 | 20,071.4 | 22,094.1 |
| Total Cash, percent | .0 | .0 | .0 | .0 | .0 | .0 | .0 | .0 | .0 | .0 |
| Account Receivables | 3,973.4 | 3,097.5 | 2,757.9 | 2,673.5 | 3,637.6 | 4,033.8 | 4,440.3 | 4,887.8 | 5,380.3 | 5,922.5 |
| Account Receivables, % | 27.43 | 16.84 | 13.07 | 13.43 | 17.53 | 17.66 | 17.66 | 17.66 | 17.66 | 17.66 |
| Inventories | 150.5 | 143.3 | 59.3 | 56.5 | 44.6 | 118.7 | 130.6 | 143.8 | 158.3 | 174.3 |
| Inventories, % | 1.04 | 0.77898 | 0.28109 | 0.28396 | 0.21481 | 0.51954 | 0.51954 | 0.51954 | 0.51954 | 0.51954 |
| Accounts Payable | 613.4 | 748.1 | 296.3 | 150.0 | 173.2 | 515.9 | 567.9 | 625.2 | 688.2 | 757.5 |
| Accounts Payable, % | 4.24 | 4.07 | 1.4 | 0.7534 | 0.83457 | 2.26 | 2.26 | 2.26 | 2.26 | 2.26 |
| Capital Expenditure | -3,273.7 | -2,940.5 | -3,239.6 | -2,973.8 | -2,285.4 | -3,649.6 | -4,017.4 | -4,422.3 | -4,867.9 | -5,358.4 |
| Capital Expenditure, % | -22.6 | -15.98 | -15.35 | -14.94 | -11.01 | -15.98 | -15.98 | -15.98 | -15.98 | -15.98 |
| Tax Rate, % | 25.93 | 25.93 | 25.93 | 25.93 | 25.93 | 25.93 | 25.93 | 25.93 | 25.93 | 25.93 |
| EBITAT | 4,368.6 | 4,494.8 | 5,078.4 | 5,522.8 | 4,402.3 | 5,842.3 | 6,431.0 | 7,079.1 | 7,792.4 | 8,577.7 |
| Depreciation | ||||||||||
| Changes in Account Receivables | ||||||||||
| Changes in Inventories | ||||||||||
| Changes in Accounts Payable | ||||||||||
| Capital Expenditure | ||||||||||
| UFCF | -1,405.5 | 3,829.2 | 3,239.0 | 4,059.7 | 2,579.9 | 3,671.7 | 3,815.7 | 4,200.2 | 4,623.4 | 5,089.4 |
| WACC, % | 5.57 | 5.56 | 5.56 | 5.57 | 5.58 | 5.57 | 5.57 | 5.57 | 5.57 | 5.57 |
| PV UFCF | ||||||||||
| SUM PV UFCF | 18,075.3 | |||||||||
| Long Term Growth Rate, % | 2.00 | |||||||||
| Free cash flow (T + 1) | 5,191 | |||||||||
| Terminal Value | 145,448 | |||||||||
| Present Terminal Value | 110,924 | |||||||||
| Enterprise Value | 128,999 | |||||||||
| Net Debt | -9,799 | |||||||||
| Equity Value | 138,798 | |||||||||
| Diluted Shares Outstanding, MM | 6,463 | |||||||||
| Equity Value Per Share | 21.48 |
Benefits of Choosing Qingdao Port International Co., Ltd. (6198HK)
- Flexible Input Options: Adjust key assumptions (growth %, margins, WACC) effortlessly for various scenarios.
- Comprehensive Market Data: Access detailed financial data for Qingdao Port International to enhance your analysis.
- Automated DCF Calculations: The template provides instant calculations for Net Present Value (NPV) and intrinsic value.
- Professional and Adaptable: A sophisticated Excel model tailored to meet your valuation requirements.
- Designed for Analysts and Investors: Perfect for evaluating projections, assessing strategies, and streamlining your workflow.
Key Features
- Genuine Financial Data: Access reliable pre-loaded historical figures and future forecasts for Qingdao Port International Co., Ltd. (6198HK).
- Adjustable Forecast Parameters: Modify highlighted fields such as WACC, growth rates, and profit margins with ease.
- Real-Time Calculations: Automatic updates for Discounted Cash Flow (DCF), Net Present Value (NPV), and cash flow assessments.
- User-Friendly Dashboard: Intuitive charts and summaries to help visualize your valuation findings.
- Suitable for All Experience Levels: A straightforward design tailored for investors, CFOs, and consultants alike.
How It Works
- Step 1: Download the prebuilt Excel template containing data for Qingdao Port International Co., Ltd. (6198HK).
- Step 2: Navigate through the pre-filled sheets to familiarize yourself with the essential metrics.
- Step 3: Revise forecasts and assumptions in the editable yellow cells (WACC, growth, margins).
- Step 4: Instantly observe the recalibrated outcomes, including the intrinsic value of Qingdao Port International Co., Ltd. (6198HK).
- Step 5: Utilize the outputs to make informed investment choices or create reports.
Why Opt for This Calculator?
- Precision: Leverage accurate financial data from Qingdao Port International Co., Ltd. (6198HK).
- Versatility: Tailored for users to easily test and adjust various inputs.
- Efficiency: Avoid the complexities of creating a DCF model from the ground up.
- Industry-Grade: Crafted with the expertise and usability standards of finance professionals.
- Intuitive: Simple to navigate, making it accessible for users without extensive financial modeling skills.
Who Should Use This Product?
- Individual Investors: Gain insights to make informed decisions regarding investments in Qingdao Port International Co., Ltd. (6198HK).
- Financial Analysts: Enhance valuation methods with effective financial models tailored for Qingdao Port International Co., Ltd. (6198HK).
- Consultants: Provide clients with accurate and timely valuation analysis related to Qingdao Port International Co., Ltd. (6198HK).
- Business Owners: Learn from the valuation practices of large entities like Qingdao Port International Co., Ltd. (6198HK) to refine your own business strategies.
- Finance Students: Acquire hands-on experience in valuation techniques through the analysis of data and cases from Qingdao Port International Co., Ltd. (6198HK).
Contents of the Template
- Historical Data: Comprehensive financial records and baseline forecasts for Qingdao Port International Co., Ltd. (6198HK).
- DCF and Levered DCF Models: In-depth templates designed to assess the intrinsic value of Qingdao Port International Co., Ltd. (6198HK).
- WACC Sheet: Pre-configured computations for the Weighted Average Cost of Capital.
- Editable Inputs: Adjust essential parameters such as growth rates, EBITDA margins, and CAPEX assumptions.
- Quarterly and Annual Statements: A thorough analysis of Qingdao Port International Co., Ltd. (6198HK)'s financial performance.
- Interactive Dashboard: Dynamically visualize valuation outcomes and projections.
Disclaimer
All information, articles, and product details provided on this website are for general informational and educational purposes only. We do not claim any ownership over, nor do we intend to infringe upon, any trademarks, copyrights, logos, brand names, or other intellectual property mentioned or depicted on this site. Such intellectual property remains the property of its respective owners, and any references here are made solely for identification or informational purposes, without implying any affiliation, endorsement, or partnership.
We make no representations or warranties, express or implied, regarding the accuracy, completeness, or suitability of any content or products presented. Nothing on this website should be construed as legal, tax, investment, financial, medical, or other professional advice. In addition, no part of this site—including articles or product references—constitutes a solicitation, recommendation, endorsement, advertisement, or offer to buy or sell any securities, franchises, or other financial instruments, particularly in jurisdictions where such activity would be unlawful.
All content is of a general nature and may not address the specific circumstances of any individual or entity. It is not a substitute for professional advice or services. Any actions you take based on the information provided here are strictly at your own risk. You accept full responsibility for any decisions or outcomes arising from your use of this website and agree to release us from any liability in connection with your use of, or reliance upon, the content or products found herein.