
|
Fast Retailing Co., Ltd. (6288.HK) DCF -Bewertung |
Fully Editable: Tailor To Your Needs In Excel Or Sheets
Professional Design: Trusted, Industry-Standard Templates
Investor-Approved Valuation Models
MAC/PC Compatible, Fully Unlocked
No Expertise Is Needed; Easy To Follow
Fast Retailing Co., Ltd. (6288.HK) Bundle
Erwerben Sie Meisterschaft über Ihre Fast Retailing Co., Ltd. (6288HK) Bewertungsanalyse mit unserem ausgefeilten DCF -Taschenrechner! Diese Excel -Vorlage wird mit genauen (6288HK) Daten vorinstalliert, sodass Sie Prognosen und Annahmen anpassen können, um den inneren Wert von Fast Retailing Co., Ltd., genau zu bestimmen.
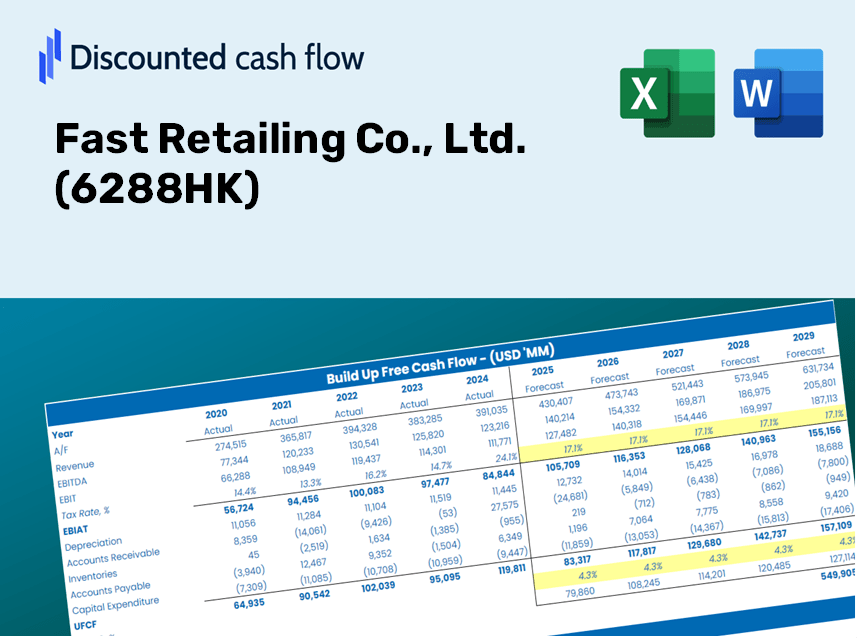
Discounted Cash Flow (DCF) - (USD MM)
| Year | AY1 2020 |
AY2 2021 |
AY3 2022 |
AY4 2023 |
AY5 2024 |
FY1 2025 |
FY2 2026 |
FY3 2027 |
FY4 2028 |
FY5 2029 |
|---|---|---|---|---|---|---|---|---|---|---|
| Revenue | 101,364.3 | 107,628.6 | 116,112.3 | 139,597.6 | 156,616.4 | 174,815.2 | 195,128.8 | 217,802.8 | 243,111.5 | 271,361.1 |
| Revenue Growth, % | 0 | 6.18 | 7.88 | 20.23 | 12.19 | 11.62 | 11.62 | 11.62 | 11.62 | 11.62 |
| EBITDA | 17,076.5 | 22,745.9 | 30,347.0 | 32,025.2 | 38,989.1 | 39,141.8 | 43,690.1 | 48,766.9 | 54,433.6 | 60,758.8 |
| EBITDA, % | 16.85 | 21.13 | 26.14 | 22.94 | 24.89 | 22.39 | 22.39 | 22.39 | 22.39 | 22.39 |
| Depreciation | 8,974.0 | 8,977.2 | 9,096.5 | 9,429.4 | 10,313.2 | 13,414.6 | 14,973.4 | 16,713.3 | 18,655.4 | 20,823.2 |
| Depreciation, % | 8.85 | 8.34 | 7.83 | 6.75 | 6.59 | 7.67 | 7.67 | 7.67 | 7.67 | 7.67 |
| EBIT | 8,102.4 | 13,768.7 | 21,250.5 | 22,595.8 | 28,675.9 | 25,727.2 | 28,716.7 | 32,053.6 | 35,778.2 | 39,935.6 |
| EBIT, % | 7.99 | 12.79 | 18.3 | 16.19 | 18.31 | 14.72 | 14.72 | 14.72 | 14.72 | 14.72 |
| Total Cash | 57,695.9 | 62,261.0 | 74,767.0 | 74,652.7 | 83,969.5 | 100,082.1 | 111,711.7 | 124,692.6 | 139,181.9 | 155,354.8 |
| Total Cash, percent | .0 | .0 | .0 | .0 | .0 | .0 | .0 | .0 | .0 | .0 |
| Account Receivables | 2,833.3 | 2,126.4 | 2,414.5 | 2,859.3 | 4,235.0 | 4,056.6 | 4,528.0 | 5,054.1 | 5,641.4 | 6,296.9 |
| Account Receivables, % | 2.8 | 1.98 | 2.08 | 2.05 | 2.7 | 2.32 | 2.32 | 2.32 | 2.32 | 2.32 |
| Inventories | 21,068.1 | 19,924.6 | 24,519.4 | 22,668.9 | 23,940.8 | 32,144.6 | 35,879.9 | 40,049.1 | 44,702.8 | 49,897.3 |
| Inventories, % | 20.78 | 18.51 | 21.12 | 16.24 | 15.29 | 18.39 | 18.39 | 18.39 | 18.39 | 18.39 |
| Accounts Payable | 7,607.2 | 9,082.7 | 15,134.4 | 14,208.5 | 19,611.2 | 18,068.2 | 20,167.7 | 22,511.2 | 25,127.0 | 28,046.8 |
| Accounts Payable, % | 7.5 | 8.44 | 13.03 | 10.18 | 12.52 | 10.34 | 10.34 | 10.34 | 10.34 | 10.34 |
| Capital Expenditure | -3,497.6 | -3,883.8 | -4,057.0 | -4,902.4 | -5,348.8 | -6,111.6 | -6,821.8 | -7,614.5 | -8,499.3 | -9,486.9 |
| Capital Expenditure, % | -3.45 | -3.61 | -3.49 | -3.51 | -3.42 | -3.5 | -3.5 | -3.5 | -3.5 | -3.5 |
| Tax Rate, % | 33.24 | 33.24 | 33.24 | 33.24 | 33.24 | 33.24 | 33.24 | 33.24 | 33.24 | 33.24 |
| EBITAT | 4,789.2 | 8,795.9 | 14,044.3 | 15,284.9 | 19,144.7 | 16,644.9 | 18,579.0 | 20,737.9 | 23,147.7 | 25,837.4 |
| Depreciation | ||||||||||
| Changes in Account Receivables | ||||||||||
| Changes in Inventories | ||||||||||
| Changes in Accounts Payable | ||||||||||
| Capital Expenditure | ||||||||||
| UFCF | -6,028.5 | 17,215.0 | 20,252.6 | 20,291.8 | 26,864.2 | 14,379.5 | 24,623.6 | 27,484.9 | 30,678.6 | 34,243.5 |
| WACC, % | 5.33 | 5.33 | 5.33 | 5.33 | 5.33 | 5.33 | 5.33 | 5.33 | 5.33 | 5.33 |
| PV UFCF | ||||||||||
| SUM PV UFCF | 110,698.1 | |||||||||
| Long Term Growth Rate, % | 2.00 | |||||||||
| Free cash flow (T + 1) | 34,928 | |||||||||
| Terminal Value | 1,048,358 | |||||||||
| Present Terminal Value | 808,563 | |||||||||
| Enterprise Value | 919,261 | |||||||||
| Net Debt | -36,103 | |||||||||
| Equity Value | 955,364 | |||||||||
| Diluted Shares Outstanding, MM | 30,724 | |||||||||
| Equity Value Per Share | 31.09 |
What You Will Receive
- Genuine Fast Retailing Financials: Access both historical and projected data for precise valuation.
- Customizable Inputs: Adjust WACC, tax rates, revenue growth, and capital expenditures as needed.
- Automated Calculations: Dynamic computation of intrinsic value and NPV.
- Scenario Analysis: Explore various scenarios to assess Fast Retailing's future performance.
- User-Friendly Design: Crafted for professionals while remaining approachable for newcomers.
Key Features
- Pre-Loaded Data: Fast Retailing’s historical financial statements and pre-filled forecasts.
- Fully Adjustable Inputs: Customize WACC, tax rates, revenue growth, and EBITDA margins.
- Instant Results: View Fast Retailing’s intrinsic value recalculating in real time.
- Clear Visual Outputs: Dashboard charts illustrate valuation results and essential metrics.
- Built for Accuracy: A professional tool tailored for analysts, investors, and finance professionals.
How It Operates
- Download the Template: Gain immediate access to the Excel-based Fast Retailing DCF Calculator for [6288HK].
- Input Your Assumptions: Modify the yellow-highlighted cells for growth rates, WACC, profit margins, and additional factors.
- Instant Calculations: The model will automatically calculate the intrinsic value of Fast Retailing.
- Test Scenarios: Experiment with various assumptions to assess potential changes in valuation.
- Analyze and Decide: Utilize the results to inform your investment or financial decisions.
Why Choose This Calculator for Fast Retailing Co., Ltd. (6288HK)?
- Designed for Experts: A sophisticated tool favored by analysts, CFOs, and business consultants.
- Accurate Financial Data: Preloaded historical and projected financials for Fast Retailing Co., Ltd. to ensure precision.
- Flexible Scenario Analysis: Effortlessly model various forecasts and assumptions.
- Transparent Results: Instantly calculates intrinsic value, NPV, and other essential metrics.
- User-Friendly Interface: Comprehensive step-by-step instructions leading you through each stage.
Who Should Use Fast Retailing's Product?
- Fashion Students: Explore merchandising strategies and apply them using actual market data.
- Researchers: Integrate industry models into academic studies or presentations.
- Investors: Validate your investment hypotheses and assess valuation metrics for Fast Retailing Co., Ltd. (6288HK).
- Market Analysts: Enhance your efficiency with a customizable financial model tailored for retail analysis.
- Entrepreneurs: Understand the evaluation methods used for major retail companies like Fast Retailing Co., Ltd. (6288HK).
Contents of the Template
- Preloaded Fast Retailing Data: Historical and projected financial data, including revenue, EBIT, and capital expenditures.
- DCF and WACC Models: Advanced spreadsheets for calculating intrinsic value and Weighted Average Cost of Capital.
- Editable Inputs: Cells highlighted in yellow for customizing revenue growth, tax rates, and discount rates.
- Financial Statements: Detailed annual and quarterly financials for in-depth analysis.
- Key Ratios: Profitability, leverage, and efficiency ratios for performance evaluation.
- Dashboard and Charts: Visual representations of valuation results and assumptions.
Disclaimer
All information, articles, and product details provided on this website are for general informational and educational purposes only. We do not claim any ownership over, nor do we intend to infringe upon, any trademarks, copyrights, logos, brand names, or other intellectual property mentioned or depicted on this site. Such intellectual property remains the property of its respective owners, and any references here are made solely for identification or informational purposes, without implying any affiliation, endorsement, or partnership.
We make no representations or warranties, express or implied, regarding the accuracy, completeness, or suitability of any content or products presented. Nothing on this website should be construed as legal, tax, investment, financial, medical, or other professional advice. In addition, no part of this site—including articles or product references—constitutes a solicitation, recommendation, endorsement, advertisement, or offer to buy or sell any securities, franchises, or other financial instruments, particularly in jurisdictions where such activity would be unlawful.
All content is of a general nature and may not address the specific circumstances of any individual or entity. It is not a substitute for professional advice or services. Any actions you take based on the information provided here are strictly at your own risk. You accept full responsibility for any decisions or outcomes arising from your use of this website and agree to release us from any liability in connection with your use of, or reliance upon, the content or products found herein.