
|
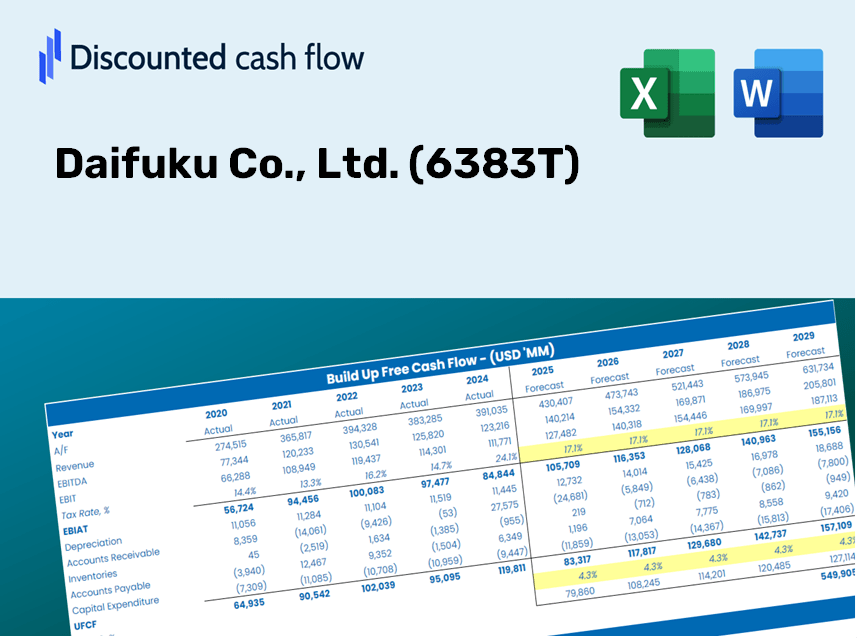
Daifuku Co., Ltd. (6383.t) DCF -Bewertung |
Fully Editable: Tailor To Your Needs In Excel Or Sheets
Professional Design: Trusted, Industry-Standard Templates
Investor-Approved Valuation Models
MAC/PC Compatible, Fully Unlocked
No Expertise Is Needed; Easy To Follow
Daifuku Co., Ltd. (6383.T) Bundle
Bewerten Sie den finanziellen Ausblick von Daifuku Co., Ltd. wie ein Experte! Dieser (6383T) DCF-Taschenrechner bietet Ihnen vorgefüllte Finanzdaten und die volle Flexibilität, um das Umsatzwachstum, die WACC, die Gewinnmargen und andere wesentliche Annahmen zu ändern, um sich an Ihren Projektionen anzupassen.
Discounted Cash Flow (DCF) - (USD MM)
| Year | AY1 2020 |
AY2 2021 |
AY3 2022 |
AY4 2023 |
AY5 2024 |
FY1 2025 |
FY2 2026 |
FY3 2027 |
FY4 2028 |
FY5 2029 |
|---|---|---|---|---|---|---|---|---|---|---|
| Revenue | 473,902.0 | 512,268.0 | 601,922.0 | 611,477.0 | 750,968.8 | 844,834.0 | 950,431.5 | 1,069,227.9 | 1,202,873.0 | 1,353,222.6 |
| Revenue Growth, % | 0 | 8.1 | 17.5 | 1.59 | 22.81 | 12.5 | 12.5 | 12.5 | 12.5 | 12.5 |
| EBITDA | 52,850.0 | 59,296.0 | 64,604.0 | 72,409.0 | 111,182.4 | 101,561.0 | 114,255.3 | 128,536.4 | 144,602.4 | 162,676.5 |
| EBITDA, % | 11.15 | 11.58 | 10.73 | 11.84 | 14.81 | 12.02 | 12.02 | 12.02 | 12.02 | 12.02 |
| Depreciation | 7,096.0 | 7,965.0 | 9,233.0 | 10,329.0 | 11,636.0 | 13,221.3 | 14,873.8 | 16,732.9 | 18,824.4 | 21,177.3 |
| Depreciation, % | 1.5 | 1.55 | 1.53 | 1.69 | 1.55 | 1.56 | 1.56 | 1.56 | 1.56 | 1.56 |
| EBIT | 45,754.0 | 51,331.0 | 55,371.0 | 62,080.0 | 99,546.4 | 88,339.7 | 99,381.5 | 111,803.4 | 125,778.0 | 141,499.2 |
| EBIT, % | 9.65 | 10.02 | 9.2 | 10.15 | 13.26 | 10.46 | 10.46 | 10.46 | 10.46 | 10.46 |
| Total Cash | 94,167.0 | 118,769.0 | 102,746.0 | 142,044.0 | 221,521.0 | 190,683.8 | 214,517.8 | 241,330.8 | 271,495.3 | 305,430.0 |
| Total Cash, percent | .0 | .0 | .0 | .0 | .0 | .0 | .0 | .0 | .0 | .0 |
| Account Receivables | 211,335.0 | 208,138.0 | 249,018.0 | 270,414.0 | 222,959.0 | 338,792.7 | 381,139.1 | 428,778.4 | 482,372.3 | 542,665.1 |
| Account Receivables, % | 44.59 | 40.63 | 41.37 | 44.22 | 29.69 | 40.1 | 40.1 | 40.1 | 40.1 | 40.1 |
| Inventories | 36,350.0 | 41,253.0 | 66,056.0 | 66,495.0 | 62,944.0 | 77,646.6 | 87,351.8 | 98,270.1 | 110,553.0 | 124,371.3 |
| Inventories, % | 7.67 | 8.05 | 10.97 | 10.87 | 8.38 | 9.19 | 9.19 | 9.19 | 9.19 | 9.19 |
| Accounts Payable | 43,778.0 | 48,046.0 | 63,581.0 | 61,154.0 | 81,758.0 | 84,598.1 | 95,172.2 | 107,068.0 | 120,450.6 | 135,506.0 |
| Accounts Payable, % | 9.24 | 9.38 | 10.56 | 10 | 10.89 | 10.01 | 10.01 | 10.01 | 10.01 | 10.01 |
| Capital Expenditure | -7,481.0 | -10,461.0 | -13,716.0 | -19,731.0 | -11,882.0 | -18,093.6 | -20,355.2 | -22,899.4 | -25,761.7 | -28,981.7 |
| Capital Expenditure, % | -1.58 | -2.04 | -2.28 | -3.23 | -1.58 | -2.14 | -2.14 | -2.14 | -2.14 | -2.14 |
| Tax Rate, % | 23.36 | 23.36 | 23.36 | 23.36 | 23.36 | 23.36 | 23.36 | 23.36 | 23.36 | 23.36 |
| EBITAT | 32,853.1 | 36,125.4 | 41,487.0 | 44,594.0 | 76,291.6 | 64,590.3 | 72,663.6 | 81,746.0 | 91,963.6 | 103,458.3 |
| Depreciation | ||||||||||
| Changes in Account Receivables | ||||||||||
| Changes in Inventories | ||||||||||
| Changes in Accounts Payable | ||||||||||
| Capital Expenditure | ||||||||||
| UFCF | -171,438.9 | 36,191.4 | -13,144.0 | 10,930.0 | 147,655.5 | -67,978.2 | 25,704.7 | 28,917.6 | 32,532.1 | 36,598.3 |
| WACC, % | 6.88 | 6.88 | 6.89 | 6.88 | 6.89 | 6.88 | 6.88 | 6.88 | 6.88 | 6.88 |
| PV UFCF | ||||||||||
| SUM PV UFCF | 33,743.6 | |||||||||
| Long Term Growth Rate, % | 2.00 | |||||||||
| Free cash flow (T + 1) | 37,330 | |||||||||
| Terminal Value | 764,248 | |||||||||
| Present Terminal Value | 547,847 | |||||||||
| Enterprise Value | 581,591 | |||||||||
| Net Debt | -151,178 | |||||||||
| Equity Value | 732,769 | |||||||||
| Diluted Shares Outstanding, MM | 387 | |||||||||
| Equity Value Per Share | 1,891.87 |
What You Will Receive
- Accurate Daifuku Financials: Features both historical and projected data for precise valuation.
- Customizable Inputs: Adjust WACC, tax rates, revenue growth, and capital expenditures as needed.
- Automatic Calculations: Intrinsic value and NPV computed in real-time.
- Scenario Analysis: Explore various scenarios to assess Daifuku's future performance.
- User-Friendly Design: Designed for professionals while remaining easy to navigate for newcomers.
Key Features
- Customizable Projection Settings: Adjust essential factors such as revenue growth, EBITDA margin, and capital expenditures.
- Instant DCF Valuation: Automatically computes intrinsic value, NPV, and additional outputs in real-time.
- High-Precision Accuracy: Leverages Daifuku's actual financial data for reliable valuation results.
- Simplified Scenario Analysis: Effortlessly explore various assumptions and compare results.
- Efficiency Booster: Avoid the hassle of building intricate valuation models from the ground up.
How It Operates
- Step 1: Download the Excel file.
- Step 2: Examine Daifuku’s pre-filled financial data and projections.
- Step 3: Adjust key inputs such as revenue growth, WACC, and tax rates (highlighted cells).
- Step 4: Observe the DCF model update in real-time as you modify the assumptions.
- Step 5: Review the outputs and leverage the results for your investment strategies.
Why Opt for This Calculator?
- All-in-One Solution: Integrates DCF, WACC, and financial ratio assessments into a single tool.
- Adjustable Parameters: Modify the highlighted fields to explore different scenarios.
- In-Depth Analysis: Automatically computes Daifuku Co., Ltd.'s intrinsic value and Net Present Value.
- Preloaded Information: Access historical and projected data for a reliable starting point.
- Expert-Level Tool: Perfect for financial analysts, investors, and business consultants.
Who Can Benefit from This Product?
- Investors: Assess the valuation of Daifuku Co., Ltd. (6383T) before making stock transactions.
- CFOs and Financial Analysts: Enhance valuation processes and evaluate forecasts effectively.
- Startup Founders: Understand how leading public companies like Daifuku Co., Ltd. (6383T) are valued in the market.
- Consultants: Provide expert valuation reports to clients based on Daifuku Co., Ltd. (6383T).
- Students and Educators: Utilize real-world scenarios to practice and teach valuation methodologies.
Contents of the Template
- Preloaded 6383T Data: Historical and projected financial information, including revenue, EBIT, and capital expenditures.
- DCF and WACC Models: Advanced spreadsheets for assessing intrinsic value and calculating Weighted Average Cost of Capital.
- Editable Inputs: Cells highlighted in yellow for modifying revenue growth rates, tax rates, and discount rates.
- Financial Statements: Detailed annual and quarterly financials for thorough analysis.
- Key Ratios: Metrics for profitability, leverage, and efficiency to assess performance.
- Dashboard and Charts: Visual representations of valuation results and underlying assumptions.
Disclaimer
All information, articles, and product details provided on this website are for general informational and educational purposes only. We do not claim any ownership over, nor do we intend to infringe upon, any trademarks, copyrights, logos, brand names, or other intellectual property mentioned or depicted on this site. Such intellectual property remains the property of its respective owners, and any references here are made solely for identification or informational purposes, without implying any affiliation, endorsement, or partnership.
We make no representations or warranties, express or implied, regarding the accuracy, completeness, or suitability of any content or products presented. Nothing on this website should be construed as legal, tax, investment, financial, medical, or other professional advice. In addition, no part of this site—including articles or product references—constitutes a solicitation, recommendation, endorsement, advertisement, or offer to buy or sell any securities, franchises, or other financial instruments, particularly in jurisdictions where such activity would be unlawful.
All content is of a general nature and may not address the specific circumstances of any individual or entity. It is not a substitute for professional advice or services. Any actions you take based on the information provided here are strictly at your own risk. You accept full responsibility for any decisions or outcomes arising from your use of this website and agree to release us from any liability in connection with your use of, or reliance upon, the content or products found herein.