
|
NTN Corporation (6472.t) DCF -Bewertung |
Fully Editable: Tailor To Your Needs In Excel Or Sheets
Professional Design: Trusted, Industry-Standard Templates
Investor-Approved Valuation Models
MAC/PC Compatible, Fully Unlocked
No Expertise Is Needed; Easy To Follow
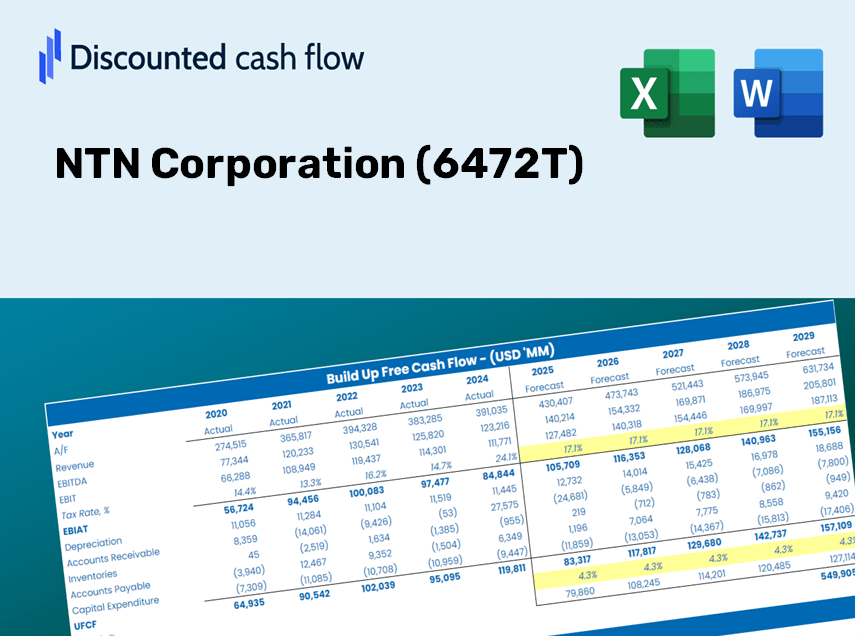
NTN Corporation (6472.T) Bundle
Vereinfachen Sie die Bewertung der NTN Corporation (6472T) mit diesem anpassbaren DCF -Taschenrechner! Mit Real NTN Corporation (6472T) Finanzdaten und einstellbaren Prognose -Inputs können Sie Szenarien testen und die NTN Corporation (6472T) in Minuten aufdecken.
Discounted Cash Flow (DCF) - (USD MM)
| Year | AY1 2020 |
AY2 2021 |
AY3 2022 |
AY4 2023 |
AY5 2024 |
FY1 2025 |
FY2 2026 |
FY3 2027 |
FY4 2028 |
FY5 2029 |
|---|---|---|---|---|---|---|---|---|---|---|
| Revenue | 562,847.0 | 642,023.0 | 773,960.0 | 836,285.0 | 825,587.0 | 911,016.2 | 1,005,285.3 | 1,109,309.2 | 1,224,097.1 | 1,350,762.9 |
| Revenue Growth, % | 0 | 14.07 | 20.55 | 8.05 | -1.28 | 10.35 | 10.35 | 10.35 | 10.35 | 10.35 |
| EBITDA | 37,727.0 | 44,939.0 | 59,409.0 | 67,086.0 | 42,967.0 | 63,051.0 | 69,575.4 | 76,774.8 | 84,719.2 | 93,485.7 |
| EBITDA, % | 6.7 | 7 | 7.68 | 8.02 | 5.2 | 6.92 | 6.92 | 6.92 | 6.92 | 6.92 |
| Depreciation | 35,478.0 | 38,058.0 | 42,262.0 | 42,016.0 | 42,593.0 | 50,788.9 | 56,044.4 | 61,843.7 | 68,243.1 | 75,304.7 |
| Depreciation, % | 6.3 | 5.93 | 5.46 | 5.02 | 5.16 | 5.57 | 5.57 | 5.57 | 5.57 | 5.57 |
| EBIT | 2,249.0 | 6,881.0 | 17,147.0 | 25,070.0 | 374.0 | 12,262.1 | 13,531.0 | 14,931.1 | 16,476.1 | 18,181.0 |
| EBIT, % | 0.39958 | 1.07 | 2.22 | 3 | 0.0453011 | 1.35 | 1.35 | 1.35 | 1.35 | 1.35 |
| Total Cash | 154,969.0 | 128,644.0 | 111,658.0 | 130,035.0 | 131,517.0 | 170,317.1 | 187,941.0 | 207,388.5 | 228,848.5 | 252,529.0 |
| Total Cash, percent | .0 | .0 | .0 | .0 | .0 | .0 | .0 | .0 | .0 | .0 |
| Account Receivables | 116,672.0 | 125,564.0 | 129,781.0 | 120,615.0 | 118,692.0 | 156,429.3 | 172,616.1 | 190,477.9 | 210,188.0 | 231,937.6 |
| Account Receivables, % | 20.73 | 19.56 | 16.77 | 14.42 | 14.38 | 17.17 | 17.17 | 17.17 | 17.17 | 17.17 |
| Inventories | 176,845.0 | 214,842.0 | 239,385.0 | 264,794.0 | 244,366.0 | 286,195.9 | 315,810.6 | 348,489.7 | 384,550.3 | 424,342.4 |
| Inventories, % | 31.42 | 33.46 | 30.93 | 31.66 | 29.6 | 31.42 | 31.42 | 31.42 | 31.42 | 31.42 |
| Accounts Payable | 118,283.0 | 121,914.0 | 135,623.0 | 65,462.0 | 128,343.0 | 147,403.9 | 162,656.8 | 179,488.0 | 198,060.9 | 218,555.6 |
| Accounts Payable, % | 21.02 | 18.99 | 17.52 | 7.83 | 15.55 | 16.18 | 16.18 | 16.18 | 16.18 | 16.18 |
| Capital Expenditure | -29,624.0 | -21,870.0 | -23,725.0 | -27,058.0 | -23,535.0 | -32,470.9 | -35,830.9 | -39,538.6 | -43,629.9 | -48,144.6 |
| Capital Expenditure, % | -5.26 | -3.41 | -3.07 | -3.24 | -2.85 | -3.56 | -3.56 | -3.56 | -3.56 | -3.56 |
| Tax Rate, % | -176.97 | -176.97 | -176.97 | -176.97 | -176.97 | -176.97 | -176.97 | -176.97 | -176.97 | -176.97 |
| EBITAT | 20,844.4 | 2,867.0 | 16,448.9 | 16,007.5 | 1,035.9 | 9,845.1 | 10,863.9 | 11,988.0 | 13,228.5 | 14,597.4 |
| Depreciation | ||||||||||
| Changes in Account Receivables | ||||||||||
| Changes in Inventories | ||||||||||
| Changes in Accounts Payable | ||||||||||
| Capital Expenditure | ||||||||||
| UFCF | -148,535.6 | -24,203.0 | 19,934.9 | -55,438.5 | 105,325.9 | -32,343.2 | 528.8 | 583.5 | 643.9 | 710.5 |
| WACC, % | 4.53 | 3.14 | 4.43 | 3.67 | 4.53 | 4.06 | 4.06 | 4.06 | 4.06 | 4.06 |
| PV UFCF | ||||||||||
| SUM PV UFCF | -28,943.6 | |||||||||
| Long Term Growth Rate, % | 3.50 | |||||||||
| Free cash flow (T + 1) | 735 | |||||||||
| Terminal Value | 131,110 | |||||||||
| Present Terminal Value | 107,448 | |||||||||
| Enterprise Value | 78,505 | |||||||||
| Net Debt | 226,279 | |||||||||
| Equity Value | -147,774 | |||||||||
| Diluted Shares Outstanding, MM | 530 | |||||||||
| Equity Value Per Share | -278.78 |
What You Will Receive
- Genuine NTN Financial Data: Pre-populated with NTN Corporation’s historical and forecasted figures for accurate assessments.
- Customizable Template: Easily adjust essential parameters like revenue growth, WACC, and EBITDA percentage.
- Instant Calculations: Watch NTN’s intrinsic value refresh immediately in response to your modifications.
- Expert Valuation Tool: Tailored for investors, analysts, and consultants in need of reliable DCF outputs.
- Intuitive Layout: Streamlined design and straightforward guidance suitable for all skill levels.
Key Features
- 🔍 Real-Life NTN Financials: Pre-filled historical and projected data for NTN Corporation (6472T).
- ✏️ Fully Customizable Inputs: Modify all essential parameters (yellow cells) such as WACC, growth %, and tax rates.
- 📊 Professional DCF Valuation: Integrated formulas calculate NTN’s intrinsic value using the Discounted Cash Flow method.
- ⚡ Instant Results: Visualize NTN’s valuation immediately after making any adjustments.
- Scenario Analysis: Evaluate and compare outcomes for different financial assumptions side-by-side.
How It Functions
- 1. Access the Template: Download and open the Excel file containing NTN Corporation’s (6472T) preloaded data.
- 2. Modify Assumptions: Adjust crucial inputs such as growth rates, WACC, and capital expenditures.
- 3. Obtain Instant Results: The DCF model automatically computes intrinsic value and NPV in real-time.
- 4. Explore Scenarios: Evaluate various forecasts to examine different valuation outcomes.
- 5. Present with Assurance: Share professional valuation insights to back your decision-making.
Why Opt for This Calculator?
- Precise Information: Authentic NTN Corporation (6472T) financial data guarantees trustworthy valuation outcomes.
- Flexible Options: Tailor essential metrics such as growth rates, WACC, and tax rates to align with your forecasts.
- Efficiency Booster: Ready-made calculations save you the hassle of starting anew.
- High-Quality Resource: Crafted for investors, analysts, and consultants alike.
- Easy to Navigate: User-friendly design and clear step-by-step guidance ensure accessibility for everyone.
Who Can Benefit from This Product?
- Professional Investors: Develop comprehensive and accurate valuation models for analyzing portfolios involving NTN Corporation (6472T).
- Corporate Finance Teams: Evaluate valuation scenarios to inform strategic decisions within their organizations.
- Consultants and Advisors: Deliver precise valuation insights to clients focused on NTN Corporation (6472T).
- Students and Educators: Leverage real market data to enhance learning and practice in financial modeling.
- Tech Enthusiasts: Gain insights into how technology firms like NTN Corporation (6472T) are valued within the industry.
Contents of the Template
- Pre-Filled DCF Model: NTN Corporation’s financial data preloaded for immediate application.
- WACC Calculator: Comprehensive calculations for the Weighted Average Cost of Capital.
- Financial Ratios: Assess NTN Corporation’s profitability, leverage, and operational efficiency.
- Editable Inputs: Modify assumptions such as growth rates, profit margins, and capital expenditures to align with your scenarios.
- Financial Statements: Annual and quarterly reports available for in-depth analysis.
- Interactive Dashboard: Effortlessly visualize key valuation metrics and results.
Disclaimer
All information, articles, and product details provided on this website are for general informational and educational purposes only. We do not claim any ownership over, nor do we intend to infringe upon, any trademarks, copyrights, logos, brand names, or other intellectual property mentioned or depicted on this site. Such intellectual property remains the property of its respective owners, and any references here are made solely for identification or informational purposes, without implying any affiliation, endorsement, or partnership.
We make no representations or warranties, express or implied, regarding the accuracy, completeness, or suitability of any content or products presented. Nothing on this website should be construed as legal, tax, investment, financial, medical, or other professional advice. In addition, no part of this site—including articles or product references—constitutes a solicitation, recommendation, endorsement, advertisement, or offer to buy or sell any securities, franchises, or other financial instruments, particularly in jurisdictions where such activity would be unlawful.
All content is of a general nature and may not address the specific circumstances of any individual or entity. It is not a substitute for professional advice or services. Any actions you take based on the information provided here are strictly at your own risk. You accept full responsibility for any decisions or outcomes arising from your use of this website and agree to release us from any liability in connection with your use of, or reliance upon, the content or products found herein.