
|
Minebea Mitsumi Inc. (6479.t) DCF -Bewertung |
Fully Editable: Tailor To Your Needs In Excel Or Sheets
Professional Design: Trusted, Industry-Standard Templates
Investor-Approved Valuation Models
MAC/PC Compatible, Fully Unlocked
No Expertise Is Needed; Easy To Follow
MINEBEA MITSUMI Inc. (6479.T) Bundle
Entdecken Sie die finanziellen Aussichten von Minebea Mitsumi Inc. (6479T) mit unserem benutzerfreundlichen DCF-Taschenrechner! Geben Sie Ihre Annahmen in Bezug auf Wachstum, Margen und Kosten ein, um den inneren Wert von Minebea Mitsumi Inc. (6479T) abzuschätzen und Ihren Investitionsansatz zu verbessern.
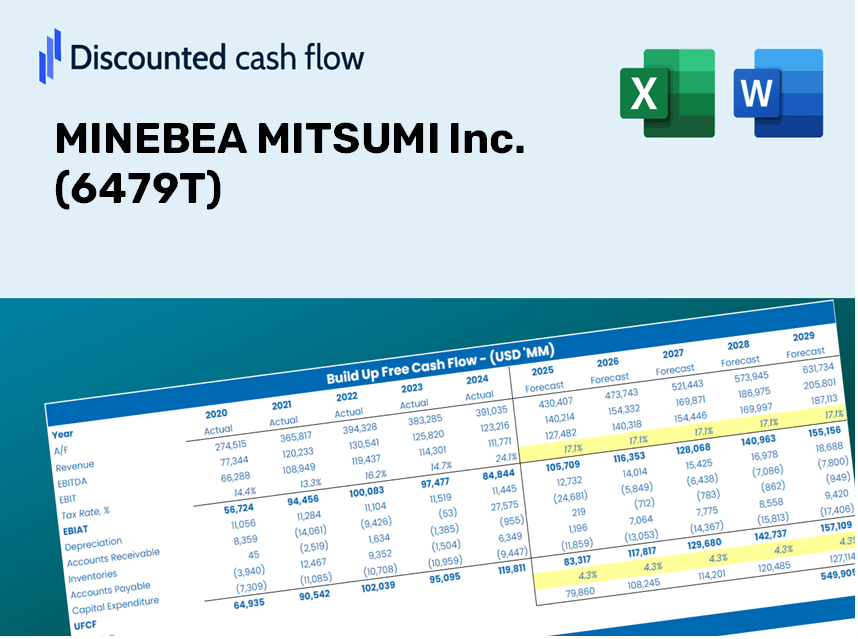
Discounted Cash Flow (DCF) - (USD MM)
| Year | AY1 2021 |
AY2 2022 |
AY3 2023 |
AY4 2024 |
AY5 2025 |
FY1 2026 |
FY2 2027 |
FY3 2028 |
FY4 2029 |
FY5 2030 |
|---|---|---|---|---|---|---|---|---|---|---|
| Revenue | 988,424.0 | 1,124,140.0 | 1,292,203.0 | 1,402,127.0 | 1,522,703.0 | 1,697,003.5 | 1,891,255.8 | 2,107,743.7 | 2,349,012.5 | 2,617,898.8 |
| Revenue Growth, % | 0 | 13.73 | 14.95 | 8.51 | 8.6 | 11.45 | 11.45 | 11.45 | 11.45 | 11.45 |
| EBITDA | 100,009.0 | 137,642.0 | 148,741.0 | 138,747.0 | 167,619.0 | 185,911.3 | 207,192.1 | 230,909.0 | 257,340.6 | 286,797.8 |
| EBITDA, % | 10.12 | 12.24 | 11.51 | 9.9 | 11.01 | 10.96 | 10.96 | 10.96 | 10.96 | 10.96 |
| Depreciation | 48,668.0 | 45,314.0 | 53,824.0 | 58,744.0 | 66,206.0 | 73,506.2 | 81,920.3 | 91,297.5 | 101,748.1 | 113,395.0 |
| Depreciation, % | 4.92 | 4.03 | 4.17 | 4.19 | 4.35 | 4.33 | 4.33 | 4.33 | 4.33 | 4.33 |
| EBIT | 51,341.0 | 92,328.0 | 94,917.0 | 80,003.0 | 101,413.0 | 112,405.1 | 125,271.9 | 139,611.5 | 155,592.5 | 173,402.8 |
| EBIT, % | 5.19 | 8.21 | 7.35 | 5.71 | 6.66 | 6.62 | 6.62 | 6.62 | 6.62 | 6.62 |
| Total Cash | 165,479.0 | 163,588.0 | 144,671.0 | 146,664.0 | 214,256.0 | 227,468.2 | 253,506.0 | 282,524.3 | 314,864.2 | 350,906.0 |
| Total Cash, percent | .0 | .0 | .0 | .0 | .0 | .0 | .0 | .0 | .0 | .0 |
| Account Receivables | 203,614.0 | 240,822.0 | 287,374.0 | 308,420.0 | 293,315.0 | 358,139.3 | 399,134.7 | 444,822.8 | 495,740.7 | 552,487.0 |
| Account Receivables, % | 20.6 | 21.42 | 22.24 | 22 | 19.26 | 21.1 | 21.1 | 21.1 | 21.1 | 21.1 |
| Inventories | 171,368.0 | 219,308.0 | 263,071.0 | 294,921.0 | 350,869.0 | 343,748.9 | 383,097.0 | 426,949.3 | 475,821.3 | 530,287.5 |
| Inventories, % | 17.34 | 19.51 | 20.36 | 21.03 | 23.04 | 20.26 | 20.26 | 20.26 | 20.26 | 20.26 |
| Accounts Payable | 142,673.0 | 170,854.0 | 172,011.0 | 196,542.0 | 213,646.0 | 240,949.4 | 268,530.4 | 299,268.5 | 333,525.1 | 371,702.9 |
| Accounts Payable, % | 14.43 | 15.2 | 13.31 | 14.02 | 14.03 | 14.2 | 14.2 | 14.2 | 14.2 | 14.2 |
| Capital Expenditure | -45,503.0 | -70,108.0 | -136,717.0 | -79,636.0 | -82,481.0 | -110,362.0 | -122,994.9 | -137,073.9 | -152,764.4 | -170,251.0 |
| Capital Expenditure, % | -4.6 | -6.24 | -10.58 | -5.68 | -5.42 | -6.5 | -6.5 | -6.5 | -6.5 | -6.5 |
| Tax Rate, % | 28.03 | 28.03 | 28.03 | 28.03 | 28.03 | 28.03 | 28.03 | 28.03 | 28.03 | 28.03 |
| EBITAT | 40,178.6 | 70,104.3 | 72,236.5 | 57,223.7 | 72,991.0 | 84,032.6 | 93,651.7 | 104,371.8 | 116,319.0 | 129,633.8 |
| Depreciation | ||||||||||
| Changes in Account Receivables | ||||||||||
| Changes in Inventories | ||||||||||
| Changes in Accounts Payable | ||||||||||
| Capital Expenditure | ||||||||||
| UFCF | -188,965.4 | -11,656.7 | -99,814.5 | 7,966.7 | 32,977.0 | 16,776.1 | -185.6 | -206.9 | -230.6 | -256.9 |
| WACC, % | 8.43 | 8.4 | 8.4 | 8.35 | 8.36 | 8.39 | 8.39 | 8.39 | 8.39 | 8.39 |
| PV UFCF | ||||||||||
| SUM PV UFCF | 14,818.5 | |||||||||
| Long Term Growth Rate, % | 2.00 | |||||||||
| Free cash flow (T + 1) | -262 | |||||||||
| Terminal Value | -4,103 | |||||||||
| Present Terminal Value | -2,742 | |||||||||
| Enterprise Value | 12,076 | |||||||||
| Net Debt | 249,341 | |||||||||
| Equity Value | -237,265 | |||||||||
| Diluted Shares Outstanding, MM | 403 | |||||||||
| Equity Value Per Share | -588.90 |
What You Will Receive
- Adjustable Forecast Inputs: Easily modify key assumptions (growth %, profit margins, WACC) to simulate various scenarios.
- Comprehensive Data: MINEBEA MITSUMI Inc.’s financial data pre-filled to kickstart your analysis.
- Automated DCF Outputs: The template calculates Net Present Value (NPV) and intrinsic value for you.
- Professional and Customizable: A refined Excel model tailored to meet your valuation requirements.
- Designed for Analysts and Investors: Perfect for assessing projections, validating strategies, and optimizing time efficiency.
Key Features
- Customizable Financial Inputs: Adjust essential variables such as revenue growth, EBITDA percentages, and capital investments tailored for MINEBEA MITSUMI Inc. (6479T).
- Instant DCF Valuation: Automatically calculates intrinsic value, NPV, and other key metrics for quick insights.
- High-Precision Analysis: Leverages MINEBEA MITSUMI Inc. (6479T)'s actual financial data for accurate valuation outcomes.
- Effortless Scenario Testing: Easily evaluate various assumptions and analyze different results side by side.
- Efficiency Booster: Streamlines the valuation process, removing the need for intricate models from the ground up.
How It Works
- 1. Access the Template: Download and open the Excel file featuring MINEBEA MITSUMI Inc.'s preloaded data.
- 2. Update Assumptions: Adjust essential inputs such as growth projections, WACC, and capital expenditures.
- 3. Instant Results: The DCF model automatically calculates intrinsic value and NPV based on your adjustments.
- 4. Explore Scenarios: Analyze various forecasts to evaluate different valuation scenarios.
- 5. Make Informed Decisions: Present expert valuation insights to back your strategic choices.
Why Select MINEBEA MITSUMI Inc. (6479T) Calculator?
- Time Efficient: Skip the hassle of building a DCF model from the ground up – it's immediately available for use.
- Enhanced Accuracy: Dependable financial data and formulas minimize valuation errors.
- Completely Customizable: Adjust the model to match your specific assumptions and forecasts.
- User-Friendly: Intuitive charts and outputs simplify result interpretation.
- Endorsed by Professionals: Crafted for experts who prioritize precision and ease of use.
Who Should Use This Product?
- Finance Students: Master valuation methods and practice with actual data related to MINEBEA MITSUMI Inc. (6479T).
- Academics: Integrate industry-standard models into your teaching or research involving MINEBEA MITSUMI Inc. (6479T).
- Investors: Validate your hypotheses and evaluate valuation results for MINEBEA MITSUMI Inc. (6479T) stocks.
- Analysts: Enhance your efficiency with a ready-made, adaptable DCF model tailored for MINEBEA MITSUMI Inc. (6479T).
- Small Business Owners: Discover how the analysis of large public companies like MINEBEA MITSUMI Inc. (6479T) can inform your business strategies.
Contents of the Template
- Operating and Balance Sheet Data: Pre-filled historical data and forecasts for MINEBEA MITSUMI Inc. (6479T), covering metrics such as revenue, EBITDA, EBIT, and capital expenditures.
- WACC Calculation: A dedicated worksheet for Weighted Average Cost of Capital (WACC), featuring key parameters like Beta, risk-free rate, and share price.
- DCF Valuation (Unlevered and Levered): Customizable Discounted Cash Flow models that illustrate intrinsic value along with comprehensive calculations.
- Financial Statements: Pre-loaded annual and quarterly financial statements for MINEBEA MITSUMI Inc. (6479T) to facilitate detailed analysis.
- Key Ratios: Includes profitability, leverage, and efficiency ratios relevant to MINEBEA MITSUMI Inc. (6479T).
- Dashboard and Charts: A visual overview of valuation outputs and underlying assumptions, designed for easy analysis of results.
Disclaimer
All information, articles, and product details provided on this website are for general informational and educational purposes only. We do not claim any ownership over, nor do we intend to infringe upon, any trademarks, copyrights, logos, brand names, or other intellectual property mentioned or depicted on this site. Such intellectual property remains the property of its respective owners, and any references here are made solely for identification or informational purposes, without implying any affiliation, endorsement, or partnership.
We make no representations or warranties, express or implied, regarding the accuracy, completeness, or suitability of any content or products presented. Nothing on this website should be construed as legal, tax, investment, financial, medical, or other professional advice. In addition, no part of this site—including articles or product references—constitutes a solicitation, recommendation, endorsement, advertisement, or offer to buy or sell any securities, franchises, or other financial instruments, particularly in jurisdictions where such activity would be unlawful.
All content is of a general nature and may not address the specific circumstances of any individual or entity. It is not a substitute for professional advice or services. Any actions you take based on the information provided here are strictly at your own risk. You accept full responsibility for any decisions or outcomes arising from your use of this website and agree to release us from any liability in connection with your use of, or reliance upon, the content or products found herein.