
|
Bairong Inc. (6608.HK) DCF -Bewertung |
Fully Editable: Tailor To Your Needs In Excel Or Sheets
Professional Design: Trusted, Industry-Standard Templates
Investor-Approved Valuation Models
MAC/PC Compatible, Fully Unlocked
No Expertise Is Needed; Easy To Follow
Bairong Inc. (6608.HK) Bundle
Verbessern Sie Ihre Anlagestrategien mit dem DCF -Taschenrechner von Bairong Inc. (6608HK)! Verwenden Sie echte Bairong -Finanzdaten, passen Sie Wachstumsprojektionen und -kosten an und beobachten Sie sofort, wie diese Modifikationen den inneren Wert von Bairong Inc. (6608HK) beeinflussen.
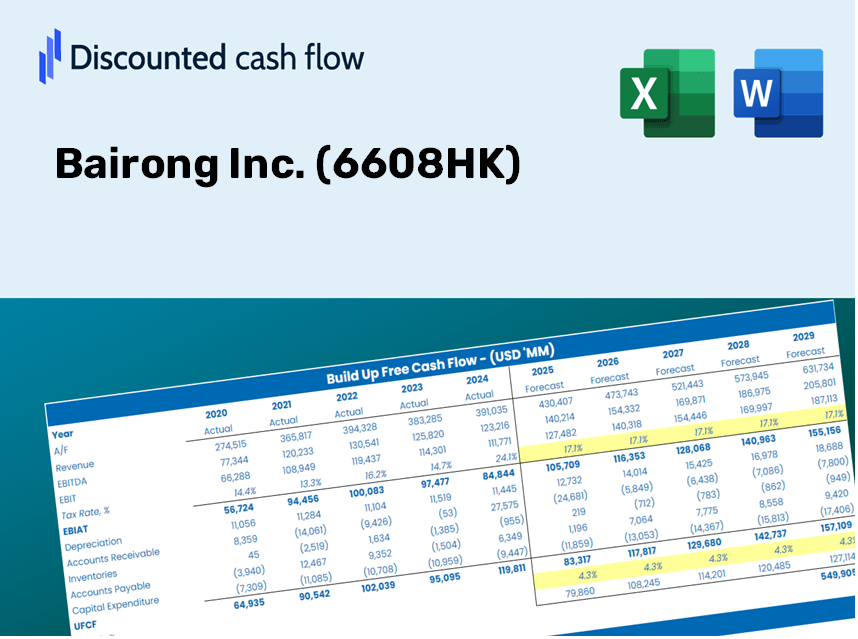
Discounted Cash Flow (DCF) - (USD MM)
| Year | AY1 2020 |
AY2 2021 |
AY3 2022 |
AY4 2023 |
AY5 2024 |
FY1 2025 |
FY2 2026 |
FY3 2027 |
FY4 2028 |
FY5 2029 |
|---|---|---|---|---|---|---|---|---|---|---|
| Revenue | 1,242.5 | 1,774.9 | 2,245.7 | 2,930.9 | 3,202.4 | 4,076.3 | 5,188.6 | 6,604.4 | 8,406.5 | 10,700.4 |
| Revenue Growth, % | 0 | 42.84 | 26.53 | 30.51 | 9.26 | 27.29 | 27.29 | 27.29 | 27.29 | 27.29 |
| EBITDA | 26.6 | 209.3 | 142.9 | 469.8 | 222.1 | 352.7 | 448.9 | 571.4 | 727.4 | 925.8 |
| EBITDA, % | 2.14 | 11.79 | 6.36 | 16.03 | 6.94 | 8.65 | 8.65 | 8.65 | 8.65 | 8.65 |
| Depreciation | 19.7 | 21.1 | 29.5 | 84.4 | 36.0 | 66.0 | 84.0 | 106.9 | 136.0 | 173.2 |
| Depreciation, % | 1.58 | 1.19 | 1.31 | 2.88 | 1.13 | 1.62 | 1.62 | 1.62 | 1.62 | 1.62 |
| EBIT | 7.0 | 188.2 | 113.3 | 385.4 | 186.1 | 286.7 | 365.0 | 464.6 | 591.3 | 752.7 |
| EBIT, % | 0.56171 | 10.6 | 5.05 | 13.15 | 5.81 | 7.03 | 7.03 | 7.03 | 7.03 | 7.03 |
| Total Cash | 946.0 | 4,205.6 | 1,899.3 | 2,233.8 | 3,786.3 | 3,562.0 | 4,534.0 | 5,771.2 | 7,345.9 | 9,350.4 |
| Total Cash, percent | .0 | .0 | .0 | .0 | .0 | .0 | .0 | .0 | .0 | .0 |
| Account Receivables | 203.6 | 273.9 | 457.4 | 215.3 | 668.9 | 655.7 | 834.6 | 1,062.3 | 1,352.2 | 1,721.1 |
| Account Receivables, % | 16.39 | 15.43 | 20.37 | 7.35 | 20.89 | 16.08 | 16.08 | 16.08 | 16.08 | 16.08 |
| Inventories | .0 | 148.4 | 271.1 | .0 | .0 | 166.6 | 212.0 | 269.9 | 343.5 | 437.2 |
| Inventories, % | 0 | 8.36 | 12.07 | 0 | 0 | 4.09 | 4.09 | 4.09 | 4.09 | 4.09 |
| Accounts Payable | 58.1 | 103.4 | 180.8 | 330.0 | 280.6 | 314.5 | 400.3 | 509.5 | 648.5 | 825.5 |
| Accounts Payable, % | 4.68 | 5.83 | 8.05 | 11.26 | 8.76 | 7.71 | 7.71 | 7.71 | 7.71 | 7.71 |
| Capital Expenditure | -20.1 | -23.1 | -26.7 | -30.9 | -64.2 | -58.4 | -74.4 | -94.7 | -120.5 | -153.4 |
| Capital Expenditure, % | -1.62 | -1.3 | -1.19 | -1.05 | -2 | -1.43 | -1.43 | -1.43 | -1.43 | -1.43 |
| Tax Rate, % | 8.67 | 8.67 | 8.67 | 8.67 | 8.67 | 8.67 | 8.67 | 8.67 | 8.67 | 8.67 |
| EBITAT | 7.0 | 188.5 | 118.8 | 390.3 | 170.0 | 281.7 | 358.6 | 456.5 | 581.0 | 739.6 |
| Depreciation | ||||||||||
| Changes in Account Receivables | ||||||||||
| Changes in Inventories | ||||||||||
| Changes in Accounts Payable | ||||||||||
| Capital Expenditure | ||||||||||
| UFCF | -139.0 | 13.2 | -107.2 | 1,106.1 | -361.1 | 169.8 | 229.7 | 292.3 | 372.1 | 473.6 |
| WACC, % | 7.47 | 7.47 | 7.47 | 7.47 | 7.45 | 7.46 | 7.46 | 7.46 | 7.46 | 7.46 |
| PV UFCF | ||||||||||
| SUM PV UFCF | 1,201.9 | |||||||||
| Long Term Growth Rate, % | 2.00 | |||||||||
| Free cash flow (T + 1) | 483 | |||||||||
| Terminal Value | 8,841 | |||||||||
| Present Terminal Value | 6,169 | |||||||||
| Enterprise Value | 7,371 | |||||||||
| Net Debt | -669 | |||||||||
| Equity Value | 8,040 | |||||||||
| Diluted Shares Outstanding, MM | 476 | |||||||||
| Equity Value Per Share | 16.90 |
Benefits of Choosing Bairong Inc. (6608HK)
- Flexible Forecast Inputs: Effortlessly adjust key assumptions (growth %, margins, WACC) to explore various scenarios.
- Comprehensive Data Set: Bairong Inc.’s financial information pre-loaded to expedite your analysis.
- Instant DCF Outputs: The template seamlessly calculates Net Present Value (NPV) and intrinsic value for you.
- Tailored and Professional Design: A refined Excel model that accommodates your specific valuation requirements.
- Optimized for Analysts and Investors: Perfect for evaluating projections, confirming strategies, and enhancing efficiency.
Key Features
- 🔍 Real-Life Bairong Financials: Pre-filled historical and projected data for Bairong Inc. (6608HK).
- ✏️ Fully Customizable Inputs: Tailor all essential parameters (yellow cells) such as WACC, growth %, and tax rates.
- 📊 Professional DCF Valuation: Integrated formulas compute Bairong’s intrinsic value using the Discounted Cash Flow method.
- ⚡ Instant Results: View Bairong’s valuation immediately after making adjustments.
- Scenario Analysis: Evaluate and compare results for different financial assumptions side-by-side.
How It Functions
- 1. Access the Template: Download and open the Excel file containing Bairong Inc.'s preloaded data.
- 2. Adjust Assumptions: Modify key variables such as growth rates, WACC, and capital expenditures.
- 3. View Results in Real-Time: The DCF model automatically calculates intrinsic value and NPV.
- 4. Experiment with Scenarios: Analyze various forecasts to evaluate different valuation outcomes.
- 5. Utilize with Confidence: Present expert valuation insights to reinforce your decisions.
Why Choose Bairong Inc. (6608HK) Calculator?
- Precision: Leverages authentic Bairong financial data for reliable results.
- Versatility: Tailored for users to easily test and adjust parameters as needed.
- Efficiency: Eliminate the complexity of creating a DCF model from the ground up.
- Expert-Level: Crafted with the accuracy and usability requirements of CFOs in mind.
- Intuitive Design: Simple to navigate, catering to both novices and experienced financial analysts.
Who Can Benefit from Bairong Inc. (6608HK)?
- Investors: Gain confidence in your investment choices with our advanced valuation tool.
- Financial Analysts: Streamline your workflow with a customizable DCF model designed for efficiency.
- Consultants: Easily tailor presentations or reports for clients using our versatile template.
- Finance Enthusiasts: Enhance your grasp of valuation methodologies with practical, real-world scenarios.
- Educators and Students: Utilize it as an effective resource for learning in finance courses.
Contents of the Template
- Pre-Filled DCF Model: Bairong Inc.'s financial data preloaded for immediate application.
- WACC Calculator: Comprehensive calculations for Weighted Average Cost of Capital.
- Financial Ratios: Assess Bairong Inc.'s profitability, leverage, and efficiency metrics.
- Editable Inputs: Adjust assumptions like growth rates, margins, and CAPEX to suit your analysis.
- Financial Statements: Access annual and quarterly reports for in-depth evaluation.
- Interactive Dashboard: Conveniently visualize essential valuation metrics and outcomes.
Disclaimer
All information, articles, and product details provided on this website are for general informational and educational purposes only. We do not claim any ownership over, nor do we intend to infringe upon, any trademarks, copyrights, logos, brand names, or other intellectual property mentioned or depicted on this site. Such intellectual property remains the property of its respective owners, and any references here are made solely for identification or informational purposes, without implying any affiliation, endorsement, or partnership.
We make no representations or warranties, express or implied, regarding the accuracy, completeness, or suitability of any content or products presented. Nothing on this website should be construed as legal, tax, investment, financial, medical, or other professional advice. In addition, no part of this site—including articles or product references—constitutes a solicitation, recommendation, endorsement, advertisement, or offer to buy or sell any securities, franchises, or other financial instruments, particularly in jurisdictions where such activity would be unlawful.
All content is of a general nature and may not address the specific circumstances of any individual or entity. It is not a substitute for professional advice or services. Any actions you take based on the information provided here are strictly at your own risk. You accept full responsibility for any decisions or outcomes arising from your use of this website and agree to release us from any liability in connection with your use of, or reliance upon, the content or products found herein.