
|
JVKKENWOOD CORPORATION (6632.T) DCF -Bewertung |
Fully Editable: Tailor To Your Needs In Excel Or Sheets
Professional Design: Trusted, Industry-Standard Templates
Investor-Approved Valuation Models
MAC/PC Compatible, Fully Unlocked
No Expertise Is Needed; Easy To Follow
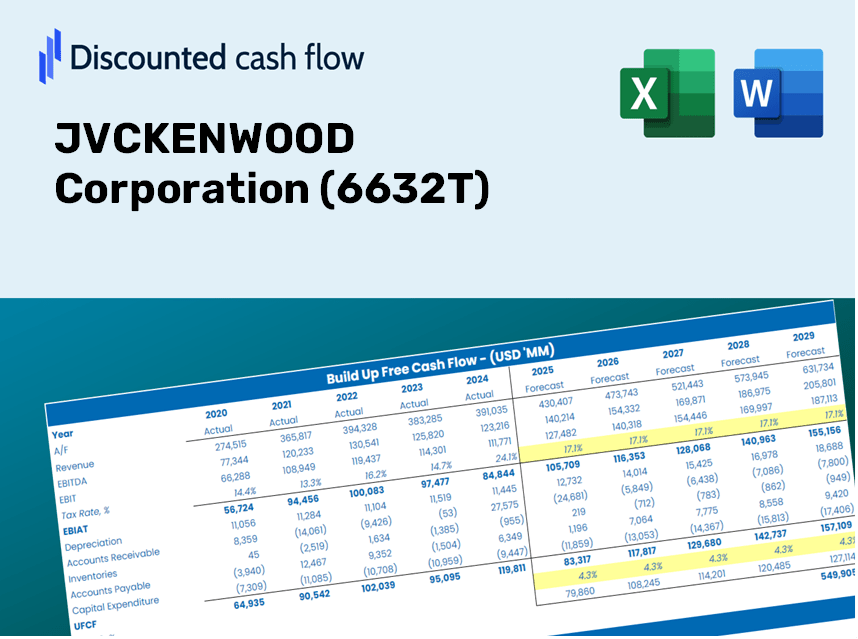
JVCKENWOOD Corporation (6632.T) Bundle
Egal, ob Sie ein Investor oder Analyst sind, dieser DCF-Taschenrechner von JVKKenwood Corporation (6632T) ist Ihr Anlaufwerk für eine genaue Bewertung. Es wird mit echten Daten von Jvkenwood vorgeladen, sodass Sie die Prognosen anpassen und die Auswirkungen in Echtzeit beobachten können.
Discounted Cash Flow (DCF) - (USD MM)
| Year | AY1 2021 |
AY2 2022 |
AY3 2023 |
AY4 2024 |
AY5 2025 |
FY1 2026 |
FY2 2027 |
FY3 2028 |
FY4 2029 |
FY5 2030 |
|---|---|---|---|---|---|---|---|---|---|---|
| Revenue | 273,609.0 | 282,088.0 | 336,910.0 | 359,459.0 | 370,308.0 | 400,158.8 | 432,416.0 | 467,273.4 | 504,940.7 | 545,644.4 |
| Revenue Growth, % | 0 | 3.1 | 19.43 | 6.69 | 3.02 | 8.06 | 8.06 | 8.06 | 8.06 | 8.06 |
| EBITDA | 24,776.0 | 26,517.0 | 39,702.0 | 37,912.0 | 40,254.0 | 41,342.0 | 44,674.7 | 48,275.9 | 52,167.5 | 56,372.8 |
| EBITDA, % | 9.06 | 9.4 | 11.78 | 10.55 | 10.87 | 10.33 | 10.33 | 10.33 | 10.33 | 10.33 |
| Depreciation | 19,316.0 | 17,120.0 | 17,615.0 | 18,182.0 | 17,292.0 | 22,476.9 | 24,288.7 | 26,246.7 | 28,362.4 | 30,648.8 |
| Depreciation, % | 7.06 | 6.07 | 5.23 | 5.06 | 4.67 | 5.62 | 5.62 | 5.62 | 5.62 | 5.62 |
| EBIT | 5,460.0 | 9,397.0 | 22,087.0 | 19,730.0 | 22,962.0 | 18,865.2 | 20,385.9 | 22,029.3 | 23,805.0 | 25,724.0 |
| EBIT, % | 2 | 3.33 | 6.56 | 5.49 | 6.2 | 4.71 | 4.71 | 4.71 | 4.71 | 4.71 |
| Total Cash | 59,644.0 | 48,707.0 | 56,186.0 | 57,874.0 | 48,597.0 | 67,999.9 | 73,481.4 | 79,404.8 | 85,805.7 | 92,722.6 |
| Total Cash, percent | .0 | .0 | .0 | .0 | .0 | .0 | .0 | .0 | .0 | .0 |
| Account Receivables | 53,509.0 | 52,910.0 | 58,157.0 | 72,611.0 | 79,354.0 | 77,794.4 | 84,065.5 | 90,842.1 | 98,165.0 | 106,078.1 |
| Account Receivables, % | 19.56 | 18.76 | 17.26 | 20.2 | 21.43 | 19.44 | 19.44 | 19.44 | 19.44 | 19.44 |
| Inventories | 42,574.0 | 55,585.0 | 67,830.0 | 62,906.0 | 58,844.0 | 71,059.2 | 76,787.3 | 82,977.2 | 89,666.1 | 96,894.1 |
| Inventories, % | 15.56 | 19.7 | 20.13 | 17.5 | 15.89 | 17.76 | 17.76 | 17.76 | 17.76 | 17.76 |
| Accounts Payable | 35,142.0 | 49,431.0 | 44,046.0 | 52,868.0 | 50,578.0 | 57,468.1 | 62,100.7 | 67,106.7 | 72,516.2 | 78,361.8 |
| Accounts Payable, % | 12.84 | 17.52 | 13.07 | 14.71 | 13.66 | 14.36 | 14.36 | 14.36 | 14.36 | 14.36 |
| Capital Expenditure | -13,912.0 | -15,962.0 | -15,812.0 | -21,009.0 | -12,711.0 | -19,778.7 | -21,373.1 | -23,096.0 | -24,957.8 | -26,969.6 |
| Capital Expenditure, % | -5.08 | -5.66 | -4.69 | -5.84 | -3.43 | -4.94 | -4.94 | -4.94 | -4.94 | -4.94 |
| Tax Rate, % | 5.79 | 5.79 | 5.79 | 5.79 | 5.79 | 5.79 | 5.79 | 5.79 | 5.79 | 5.79 |
| EBITAT | 2,594.5 | 6,481.3 | 16,939.2 | 14,075.4 | 21,632.6 | 13,535.2 | 14,626.3 | 15,805.3 | 17,079.4 | 18,456.2 |
| Depreciation | ||||||||||
| Changes in Account Receivables | ||||||||||
| Changes in Inventories | ||||||||||
| Changes in Accounts Payable | ||||||||||
| Capital Expenditure | ||||||||||
| UFCF | -52,942.5 | 9,516.3 | -4,134.8 | 10,540.4 | 21,242.6 | 12,467.9 | 10,175.3 | 10,995.5 | 11,881.9 | 12,839.7 |
| WACC, % | 5.83 | 6 | 6.07 | 6.02 | 6.21 | 6.03 | 6.03 | 6.03 | 6.03 | 6.03 |
| PV UFCF | ||||||||||
| SUM PV UFCF | 49,022.3 | |||||||||
| Long Term Growth Rate, % | 0.50 | |||||||||
| Free cash flow (T + 1) | 12,904 | |||||||||
| Terminal Value | 233,548 | |||||||||
| Present Terminal Value | 174,314 | |||||||||
| Enterprise Value | 223,337 | |||||||||
| Net Debt | 1,777 | |||||||||
| Equity Value | 221,560 | |||||||||
| Diluted Shares Outstanding, MM | 151 | |||||||||
| Equity Value Per Share | 1,464.97 |
What You Will Receive
- Customizable Excel Template: A fully adaptive Excel-based DCF Calculator featuring pre-filled financial data for JVCKENWOOD Corporation (6632T).
- Comprehensive Data: Access to historical figures and forward-looking projections (highlighted in the yellow cells).
- Adjustable Forecasting: Modify key assumptions such as revenue growth, EBITDA margin, and WACC.
- Real-Time Calculations: Instantly observe how your inputs influence JVCKENWOOD’s valuation.
- Professional Resource: Designed for investors, CFOs, consultants, and financial analysts.
- Intuitive Layout: Organized for easy navigation and usability, complete with step-by-step guidance.
Key Features
- Pre-Loaded Data: JVCKENWOOD's historical financial statements and pre-filled forecasts.
- Fully Adjustable Inputs: Customize WACC, tax rates, revenue growth, and EBITDA margins as needed.
- Instant Results: View JVCKENWOOD's intrinsic value updating in real time.
- Clear Visual Outputs: Dashboard charts illustrate valuation results and important metrics.
- Built for Accuracy: A professional-grade tool for analysts, investors, and financial specialists.
How It Works
- Step 1: Download the prebuilt Excel template featuring JVCKENWOOD Corporation's (6632T) data.
- Step 2: Navigate through the pre-filled sheets to familiarize yourself with the essential metrics.
- Step 3: Modify your projections and assumptions in the editable yellow cells (WACC, growth, margins).
- Step 4: View updated results in real-time, including JVCKENWOOD Corporation's (6632T) intrinsic value.
- Step 5: Utilize the outputs to make informed investment choices or create detailed reports.
Why Opt for This Calculator for JVCKENWOOD Corporation (6632T)?
- Designed for Professionals: A sophisticated tool utilized by analysts, CFOs, and consultants.
- Accurate Data: JVCKENWOOD's historical and projected financials are preloaded for precise results.
- Scenario Analysis: Easily simulate various forecasts and assumptions.
- Transparent Results: Automatically computes intrinsic value, NPV, and essential metrics.
- User-Friendly: Step-by-step guidance ensures a smooth experience throughout the process.
Who Should Utilize This Product?
- Investors: Precisely evaluate JVCKENWOOD Corporation’s fair value prior to making investment choices.
- CFOs: Utilize a high-quality DCF model for comprehensive financial reporting and analysis.
- Consultants: Expedite the customization of the template for client valuation reports.
- Entrepreneurs: Acquire knowledge of financial modeling practices employed by industry leaders.
- Educators: Implement it as a resource for teaching valuation techniques.
Contents of the Template
- Pre-Filled Data: Contains JVCKENWOOD Corporation's historical financials and projections.
- Discounted Cash Flow Model: An editable DCF valuation model with automated calculations.
- Weighted Average Cost of Capital (WACC): A specific sheet for calculating WACC based on tailored inputs.
- Key Financial Ratios: Examine JVCKENWOOD's profitability, efficiency, and leverage.
- Customizable Inputs: Easily modify revenue growth, profit margins, and tax rates.
- Clear Dashboard: Visual charts and tables that summarize essential valuation outcomes.
Disclaimer
All information, articles, and product details provided on this website are for general informational and educational purposes only. We do not claim any ownership over, nor do we intend to infringe upon, any trademarks, copyrights, logos, brand names, or other intellectual property mentioned or depicted on this site. Such intellectual property remains the property of its respective owners, and any references here are made solely for identification or informational purposes, without implying any affiliation, endorsement, or partnership.
We make no representations or warranties, express or implied, regarding the accuracy, completeness, or suitability of any content or products presented. Nothing on this website should be construed as legal, tax, investment, financial, medical, or other professional advice. In addition, no part of this site—including articles or product references—constitutes a solicitation, recommendation, endorsement, advertisement, or offer to buy or sell any securities, franchises, or other financial instruments, particularly in jurisdictions where such activity would be unlawful.
All content is of a general nature and may not address the specific circumstances of any individual or entity. It is not a substitute for professional advice or services. Any actions you take based on the information provided here are strictly at your own risk. You accept full responsibility for any decisions or outcomes arising from your use of this website and agree to release us from any liability in connection with your use of, or reliance upon, the content or products found herein.