
|
Baiwang Co Ltd (6657.HK) DCF -Bewertung |
Fully Editable: Tailor To Your Needs In Excel Or Sheets
Professional Design: Trusted, Industry-Standard Templates
Investor-Approved Valuation Models
MAC/PC Compatible, Fully Unlocked
No Expertise Is Needed; Easy To Follow
Baiwang Co Ltd (6657.HK) Bundle
Möchten Sie den inneren Wert von Baiwang Co Ltd bewerten? Unser (6657HK) DCF-Taschenrechner integriert reale Daten mit umfangreichen Anpassungsfunktionen, sodass Sie Prognosen anpassen und Ihre Anlagestrategien verbessern können.
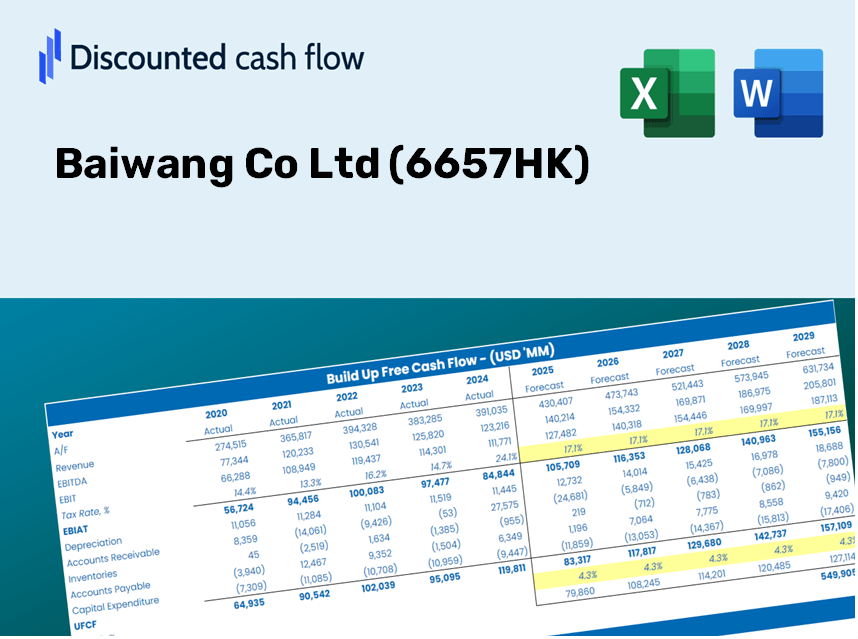
Discounted Cash Flow (DCF) - (USD MM)
| Year | AY1 2020 |
AY2 2021 |
AY3 2022 |
AY4 2023 |
AY5 2024 |
FY1 2025 |
FY2 2026 |
FY3 2027 |
FY4 2028 |
FY5 2029 |
|---|---|---|---|---|---|---|---|---|---|---|
| Revenue | 318.1 | 495.8 | 574.4 | 779.0 | 720.2 | 900.0 | 1,124.5 | 1,405.1 | 1,755.7 | 2,193.8 |
| Revenue Growth, % | 0 | 55.87 | 15.87 | 35.61 | -7.54 | 24.95 | 24.95 | 24.95 | 24.95 | 24.95 |
| EBITDA | -116.5 | -204.2 | -100.3 | -371.1 | -189.6 | -304.6 | -380.6 | -475.6 | -594.3 | -742.6 |
| EBITDA, % | -36.64 | -41.18 | -17.46 | -47.64 | -26.33 | -33.85 | -33.85 | -33.85 | -33.85 | -33.85 |
| Depreciation | 7.0 | 6.9 | 4.7 | 20.2 | 5.0 | 13.8 | 17.3 | 21.6 | 27.0 | 33.7 |
| Depreciation, % | 2.19 | 1.39 | 0.8131 | 2.59 | 0.69553 | 1.54 | 1.54 | 1.54 | 1.54 | 1.54 |
| EBIT | -123.5 | -211.1 | -105.0 | -391.3 | -194.6 | -318.5 | -397.9 | -497.2 | -621.3 | -776.3 |
| EBIT, % | -38.83 | -42.58 | -18.27 | -50.23 | -27.03 | -35.39 | -35.39 | -35.39 | -35.39 | -35.39 |
| Total Cash | 550.6 | 905.4 | 785.1 | 779.1 | 788.6 | 900.0 | 1,124.5 | 1,405.1 | 1,755.7 | 2,193.8 |
| Total Cash, percent | .0 | .0 | .0 | .0 | .0 | .0 | .0 | .0 | .0 | .0 |
| Account Receivables | 108.5 | 131.6 | 127.7 | 149.6 | 170.8 | 226.4 | 282.9 | 353.5 | 441.6 | 551.8 |
| Account Receivables, % | 34.11 | 26.53 | 22.22 | 19.2 | 23.71 | 25.16 | 25.16 | 25.16 | 25.16 | 25.16 |
| Inventories | 14.6 | 9.8 | 12.0 | 4.0 | 2.6 | 17.2 | 21.5 | 26.8 | 33.5 | 41.9 |
| Inventories, % | 4.6 | 1.98 | 2.09 | 0.51627 | 0.36271 | 1.91 | 1.91 | 1.91 | 1.91 | 1.91 |
| Accounts Payable | 30.3 | 38.4 | 33.7 | 44.7 | 45.4 | 63.3 | 79.1 | 98.9 | 123.5 | 154.3 |
| Accounts Payable, % | 9.52 | 7.75 | 5.87 | 5.73 | 6.31 | 7.04 | 7.04 | 7.04 | 7.04 | 7.04 |
| Capital Expenditure | -10.3 | -6.4 | -5.7 | -6.7 | -3.5 | -12.3 | -15.4 | -19.3 | -24.1 | -30.1 |
| Capital Expenditure, % | -3.24 | -1.29 | -0.99088 | -0.85583 | -0.47997 | -1.37 | -1.37 | -1.37 | -1.37 | -1.37 |
| Tax Rate, % | -0.0700796 | -0.0700796 | -0.0700796 | -0.0700796 | -0.0700796 | -0.0700796 | -0.0700796 | -0.0700796 | -0.0700796 | -0.0700796 |
| EBITAT | -123.5 | -210.4 | -103.3 | -390.0 | -194.8 | -317.0 | -396.1 | -495.0 | -618.5 | -772.8 |
| Depreciation | ||||||||||
| Changes in Account Receivables | ||||||||||
| Changes in Inventories | ||||||||||
| Changes in Accounts Payable | ||||||||||
| Capital Expenditure | ||||||||||
| UFCF | -219.7 | -220.0 | -107.3 | -379.5 | -212.2 | -367.9 | -439.2 | -548.8 | -685.8 | -856.9 |
| WACC, % | 4.69 | 4.69 | 4.69 | 4.69 | 4.69 | 4.69 | 4.69 | 4.69 | 4.69 | 4.69 |
| PV UFCF | ||||||||||
| SUM PV UFCF | -2,482.6 | |||||||||
| Long Term Growth Rate, % | 2.00 | |||||||||
| Free cash flow (T + 1) | -874 | |||||||||
| Terminal Value | -32,475 | |||||||||
| Present Terminal Value | -25,822 | |||||||||
| Enterprise Value | -28,305 | |||||||||
| Net Debt | -482 | |||||||||
| Equity Value | -27,823 | |||||||||
| Diluted Shares Outstanding, MM | 183 | |||||||||
| Equity Value Per Share | -151.78 |
What You Will Receive
- Authentic 6657HK Financials: Comprehensive historical and projected data for precise valuation.
- Customizable Parameters: Adjust WACC, tax rates, revenue growth, and capital expenditures as needed.
- Automated Calculations: Dynamic computations for intrinsic value and NPV.
- Scenario Analysis: Explore various scenarios to assess Baiwang Co Ltd's future performance.
- User-Friendly Design: Engineered for professionals while remaining beginner-friendly.
Key Features
- Current Data for Baiwang Co Ltd (6657HK): Equipped with the company’s historical financial figures and future projections.
- Customizable Input Options: Modify revenue growth rates, profit margins, discount rates, tax obligations, and capital expenses.
- Interactive Valuation Model: Automatically refreshes Net Present Value (NPV) and intrinsic value according to your adjustments.
- Scenario Analysis: Develop various forecasting scenarios to examine different valuation results.
- User-Friendly Interface: Designed to be straightforward and accessible for both professionals and novices.
How It Works
- Step 1: Download the ready-to-use Excel template featuring Baiwang Co Ltd's (6657HK) data.
- Step 2: Navigate through the pre-filled sheets to familiarize yourself with the essential metrics.
- Step 3: Revise forecasts and assumptions in the customizable yellow cells (WACC, growth rate, profit margins).
- Step 4: Instantly observe the recalculated results, including Baiwang Co Ltd's (6657HK) intrinsic value.
- Step 5: Use the insights gained to make informed investment decisions or produce detailed reports based on the outputs.
Why Opt for the Baiwang Co Ltd (6657HK) Calculator?
- Time-Efficient: Skip the hassle of building a DCF model from scratch – it’s ready for immediate use.
- Enhanced Accuracy: Dependable financial data and formulas minimize valuation errors.
- Completely Customizable: Adjust the model to align with your specific assumptions and forecasts.
- User-Friendly Insights: Intuitive charts and outputs simplify result analysis.
- Endorsed by Professionals: Crafted for industry experts who prioritize accuracy and functionality.
Who Can Benefit from Baiwang Co Ltd (6657HK)?
- Investors: Make informed investment choices with our comprehensive analysis tools.
- Financial Analysts: Streamline your workflow with our customizable financial modeling templates.
- Consultants: Effortlessly tailor reports and presentations for your clients using our resources.
- Finance Enthusiasts: Enhance your understanding of financial strategies and valuation through practical examples.
- Educators and Students: Utilize our materials as hands-on learning aids in finance education.
Contents of the Template
- Comprehensive DCF Model: Editable template featuring in-depth valuation computations.
- Real-World Data: Baiwang Co Ltd’s (6657HK) historical and forecasted financials preloaded for examination.
- Customizable Parameters: Modify WACC, growth rates, and tax assumptions to explore various scenarios.
- Financial Statements: Complete annual and quarterly breakdowns for enhanced insights.
- Key Ratios: Integrated analysis for evaluating profitability, efficiency, and leverage.
- Dashboard with Visual Outputs: Charts and tables designed for clear, actionable insights.
Disclaimer
All information, articles, and product details provided on this website are for general informational and educational purposes only. We do not claim any ownership over, nor do we intend to infringe upon, any trademarks, copyrights, logos, brand names, or other intellectual property mentioned or depicted on this site. Such intellectual property remains the property of its respective owners, and any references here are made solely for identification or informational purposes, without implying any affiliation, endorsement, or partnership.
We make no representations or warranties, express or implied, regarding the accuracy, completeness, or suitability of any content or products presented. Nothing on this website should be construed as legal, tax, investment, financial, medical, or other professional advice. In addition, no part of this site—including articles or product references—constitutes a solicitation, recommendation, endorsement, advertisement, or offer to buy or sell any securities, franchises, or other financial instruments, particularly in jurisdictions where such activity would be unlawful.
All content is of a general nature and may not address the specific circumstances of any individual or entity. It is not a substitute for professional advice or services. Any actions you take based on the information provided here are strictly at your own risk. You accept full responsibility for any decisions or outcomes arising from your use of this website and agree to release us from any liability in connection with your use of, or reliance upon, the content or products found herein.