
|
Sanken Electric Co., Ltd. (6707.t) DCF -Bewertung |
Fully Editable: Tailor To Your Needs In Excel Or Sheets
Professional Design: Trusted, Industry-Standard Templates
Investor-Approved Valuation Models
MAC/PC Compatible, Fully Unlocked
No Expertise Is Needed; Easy To Follow
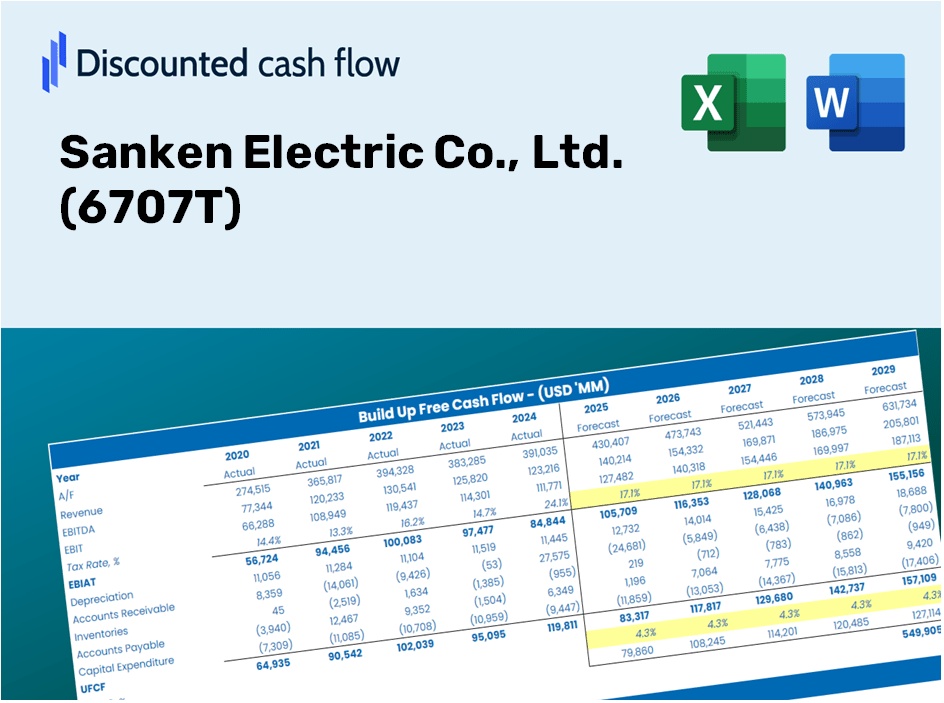
Sanken Electric Co., Ltd. (6707.T) Bundle
Unabhängig davon, ob Sie ein Investor oder Analyst sind, ist dieser (6707T) DCF-Taschenrechner Ihr Go-to-Tool für eine genaue Bewertung. Mit Sanken Electric Co., Ltd. Real Data, können Sie Prognosen anpassen und die Effekte in Echtzeit beobachten.
Discounted Cash Flow (DCF) - (USD MM)
| Year | AY1 2021 |
AY2 2022 |
AY3 2023 |
AY4 2024 |
AY5 2025 |
FY1 2026 |
FY2 2027 |
FY3 2028 |
FY4 2029 |
FY5 2030 |
|---|---|---|---|---|---|---|---|---|---|---|
| Revenue | 156,795.0 | 175,660.0 | 225,387.0 | 235,221.0 | 121,619.0 | 120,526.7 | 119,444.3 | 118,371.6 | 117,308.5 | 116,254.9 |
| Revenue Growth, % | 0 | 12.03 | 28.31 | 4.36 | -48.3 | -0.8981 | -0.8981 | -0.8981 | -0.8981 | -0.8981 |
| EBITDA | 6,380.0 | 27,045.0 | 42,916.0 | 32,963.0 | 63,152.0 | 25,177.1 | 24,951.0 | 24,726.9 | 24,504.8 | 24,284.7 |
| EBITDA, % | 4.07 | 15.4 | 19.04 | 14.01 | 51.93 | 20.89 | 20.89 | 20.89 | 20.89 | 20.89 |
| Depreciation | 12,683.0 | 13,324.0 | 15,676.0 | 20,848.0 | 10,843.0 | 9,740.5 | 9,653.0 | 9,566.3 | 9,480.4 | 9,395.2 |
| Depreciation, % | 8.09 | 7.59 | 6.96 | 8.86 | 8.92 | 8.08 | 8.08 | 8.08 | 8.08 | 8.08 |
| EBIT | -6,303.0 | 13,721.0 | 27,240.0 | 12,115.0 | 52,309.0 | 15,436.6 | 15,298.0 | 15,160.6 | 15,024.4 | 14,889.5 |
| EBIT, % | -4.02 | 7.81 | 12.09 | 5.15 | 43.01 | 12.81 | 12.81 | 12.81 | 12.81 | 12.81 |
| Total Cash | 60,990.0 | 58,959.0 | 65,435.0 | 50,363.0 | 51,405.0 | 39,815.4 | 39,457.9 | 39,103.5 | 38,752.3 | 38,404.3 |
| Total Cash, percent | .0 | .0 | .0 | .0 | .0 | .0 | .0 | .0 | .0 | .0 |
| Account Receivables | 36,916.0 | 35,599.0 | 40,014.0 | 35,893.0 | 23,624.0 | 23,200.7 | 22,992.4 | 22,785.9 | 22,581.2 | 22,378.4 |
| Account Receivables, % | 23.54 | 20.27 | 17.75 | 15.26 | 19.42 | 19.25 | 19.25 | 19.25 | 19.25 | 19.25 |
| Inventories | 41,238.0 | 42,016.0 | 59,274.0 | 69,544.0 | 43,670.0 | 34,227.4 | 33,920.0 | 33,615.4 | 33,313.5 | 33,014.3 |
| Inventories, % | 26.3 | 23.92 | 26.3 | 29.57 | 35.91 | 28.4 | 28.4 | 28.4 | 28.4 | 28.4 |
| Accounts Payable | 20,870.0 | 17,916.0 | 20,160.0 | 15,564.0 | 9,797.0 | 11,360.0 | 11,258.0 | 11,156.9 | 11,056.7 | 10,957.4 |
| Accounts Payable, % | 13.31 | 10.2 | 8.94 | 6.62 | 8.06 | 9.43 | 9.43 | 9.43 | 9.43 | 9.43 |
| Capital Expenditure | -10,795.0 | -17,749.0 | -23,086.0 | -30,376.0 | -17,837.0 | -13,212.6 | -13,093.9 | -12,976.3 | -12,859.8 | -12,744.3 |
| Capital Expenditure, % | -6.88 | -10.1 | -10.24 | -12.91 | -14.67 | -10.96 | -10.96 | -10.96 | -10.96 | -10.96 |
| Tax Rate, % | -0.85741 | -0.85741 | -0.85741 | -0.85741 | -0.85741 | -0.85741 | -0.85741 | -0.85741 | -0.85741 | -0.85741 |
| EBITAT | -6,088.4 | 3,311.6 | 9,892.5 | -10,312.4 | 52,757.5 | 7,935.9 | 7,864.6 | 7,794.0 | 7,724.0 | 7,654.6 |
| Depreciation | ||||||||||
| Changes in Account Receivables | ||||||||||
| Changes in Inventories | ||||||||||
| Changes in Accounts Payable | ||||||||||
| Capital Expenditure | ||||||||||
| UFCF | -61,484.4 | -3,528.4 | -16,946.5 | -30,585.4 | 78,139.5 | 15,892.6 | 4,837.4 | 4,793.9 | 4,750.9 | 4,708.2 |
| WACC, % | 8.53 | 7.84 | 7.96 | 7.61 | 8.57 | 8.1 | 8.1 | 8.1 | 8.1 | 8.1 |
| PV UFCF | ||||||||||
| SUM PV UFCF | 29,304.9 | |||||||||
| Long Term Growth Rate, % | 1.00 | |||||||||
| Free cash flow (T + 1) | 4,755 | |||||||||
| Terminal Value | 66,972 | |||||||||
| Present Terminal Value | 45,369 | |||||||||
| Enterprise Value | 74,674 | |||||||||
| Net Debt | 11,736 | |||||||||
| Equity Value | 62,938 | |||||||||
| Diluted Shares Outstanding, MM | 24 | |||||||||
| Equity Value Per Share | 2,619.03 |
What You Will Receive
- Authentic Sanken Electric Financial Data: Pre-populated with Sanken’s historical and projected figures for accurate analysis.
- Completely Customizable Template: Effortlessly adjust critical inputs like revenue growth, WACC, and EBITDA %.
- Instant Calculations: Monitor Sanken Electric’s intrinsic value recalibrate in real-time as you make adjustments.
- Professional Valuation Tool: Tailored for investors, analysts, and consultants seeking reliable DCF outcomes.
- Intuitive Design: Streamlined layout and straightforward instructions suitable for users of all experience levels.
Key Features
- 🔍 Real-Life Sanken Financials: Pre-loaded historical and projected financial data for Sanken Electric Co., Ltd. (6707T).
- ✏️ Fully Customizable Inputs: Modify essential parameters (yellow cells) such as WACC, growth %, and tax rates to fit your analysis.
- 📊 Professional DCF Valuation: Integrated formulas calculate Sanken's intrinsic value through the Discounted Cash Flow method.
- ⚡ Instant Results: Observe Sanken's valuation immediately as you adjust the inputs.
- Scenario Analysis: Evaluate and compare the effects of different financial assumptions side-by-side.
How It Functions
- Step 1: Download the Excel spreadsheet.
- Step 2: Examine the pre-filled Sanken Electric data (both historical and projected).
- Step 3: Modify the key assumptions (highlighted in yellow) according to your analysis.
- Step 4: Observe the automatic updates for Sanken Electric's intrinsic value.
- Step 5: Utilize the results for your investment strategies or reporting needs.
Why Opt for This Calculator for Sanken Electric Co., Ltd. (6707T)?
- User-Friendly Interface: Perfectly crafted for both novices and seasoned users.
- Customizable Inputs: Easily adjust parameters to suit your financial analysis.
- Real-Time Updates: Instantly view changes in Sanken's valuation as you modify inputs.
- Pre-Configured Data: Comes loaded with Sanken's actual financials for swift evaluations.
- Relied Upon by Experts: A go-to tool for investors and analysts making strategic choices.
Who Can Benefit from Sanken Electric Co., Ltd. (6707T)?
- Investors: Utilize a top-tier valuation tool to make informed investment choices.
- Financial Analysts: Enhance efficiency with a ready-to-use DCF model that can be tailored to your needs.
- Consultants: Seamlessly modify the template for impactful client presentations or reports.
- Finance Enthusiasts: Expand your knowledge of valuation methods through practical, real-world applications.
- Educators and Students: Leverage this resource as an effective educational aid in finance-related studies.
Contents of the Template
- Historical Data: Includes Sanken Electric Co., Ltd.'s past financial records and baseline forecasts.
- DCF and Levered DCF Models: Comprehensive templates for determining the intrinsic value of Sanken Electric Co., Ltd. (6707T).
- WACC Sheet: Pre-configured calculations for Weighted Average Cost of Capital.
- Editable Inputs: Adjust key parameters such as growth rates, EBITDA percentages, and CAPEX assumptions.
- Quarterly and Annual Statements: Detailed analysis of Sanken Electric Co., Ltd.'s financials.
- Interactive Dashboard: Dynamically visualize valuation results and future projections.
Disclaimer
All information, articles, and product details provided on this website are for general informational and educational purposes only. We do not claim any ownership over, nor do we intend to infringe upon, any trademarks, copyrights, logos, brand names, or other intellectual property mentioned or depicted on this site. Such intellectual property remains the property of its respective owners, and any references here are made solely for identification or informational purposes, without implying any affiliation, endorsement, or partnership.
We make no representations or warranties, express or implied, regarding the accuracy, completeness, or suitability of any content or products presented. Nothing on this website should be construed as legal, tax, investment, financial, medical, or other professional advice. In addition, no part of this site—including articles or product references—constitutes a solicitation, recommendation, endorsement, advertisement, or offer to buy or sell any securities, franchises, or other financial instruments, particularly in jurisdictions where such activity would be unlawful.
All content is of a general nature and may not address the specific circumstances of any individual or entity. It is not a substitute for professional advice or services. Any actions you take based on the information provided here are strictly at your own risk. You accept full responsibility for any decisions or outcomes arising from your use of this website and agree to release us from any liability in connection with your use of, or reliance upon, the content or products found herein.