
|
VORWEGEST CORPORATION (6857.T) DCF -Bewertung |
Fully Editable: Tailor To Your Needs In Excel Or Sheets
Professional Design: Trusted, Industry-Standard Templates
Investor-Approved Valuation Models
MAC/PC Compatible, Fully Unlocked
No Expertise Is Needed; Easy To Follow
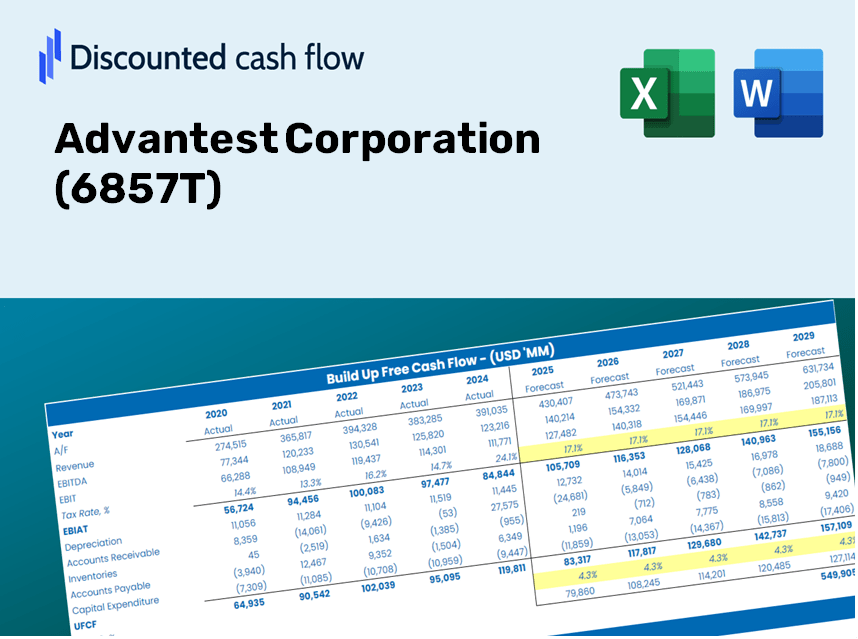
Advantest Corporation (6857.T) Bundle
Möchten Sie den inneren Wert der Vorteile des Unternehmens beurteilen? Unser (6857T) DCF-Taschenrechner verbindet reale Daten mit umfangreichen Anpassungsfunktionen, sodass Sie Prognosen anpassen und Ihre Investitionsauswahl verbessern können.
Discounted Cash Flow (DCF) - (USD MM)
| Year | AY1 2020 |
AY2 2021 |
AY3 2022 |
AY4 2023 |
AY5 2024 |
FY1 2025 |
FY2 2026 |
FY3 2027 |
FY4 2028 |
FY5 2029 |
|---|---|---|---|---|---|---|---|---|---|---|
| Revenue | 312,789.0 | 416,901.0 | 560,191.0 | 486,507.0 | 779,707.0 | 1,003,421.1 | 1,291,323.5 | 1,661,831.0 | 2,138,644.8 | 2,752,266.4 |
| Revenue Growth, % | 0 | 33.29 | 34.37 | -13.15 | 60.27 | 28.69 | 28.69 | 28.69 | 28.69 | 28.69 |
| EBITDA | 83,249.0 | 131,590.0 | 193,378.0 | 105,630.0 | 257,131.0 | 295,786.0 | 380,653.1 | 489,870.4 | 630,424.4 | 811,306.2 |
| EBITDA, % | 26.62 | 31.56 | 34.52 | 21.71 | 32.98 | 29.48 | 29.48 | 29.48 | 29.48 | 29.48 |
| Depreciation | 11,756.0 | 14,968.0 | 21,396.0 | 26,104.0 | 27,075.0 | 40,149.3 | 51,669.0 | 66,493.9 | 85,572.4 | 110,124.8 |
| Depreciation, % | 3.76 | 3.59 | 3.82 | 5.37 | 3.47 | 4 | 4 | 4 | 4 | 4 |
| EBIT | 71,493.0 | 116,622.0 | 171,982.0 | 79,526.0 | 230,056.0 | 255,636.7 | 328,984.1 | 423,376.5 | 544,852.0 | 701,181.3 |
| EBIT, % | 22.86 | 27.97 | 30.7 | 16.35 | 29.51 | 25.48 | 25.48 | 25.48 | 25.48 | 25.48 |
| Total Cash | 149,164.0 | 116,582.0 | 85,537.0 | 106,702.0 | 262,544.0 | 294,054.5 | 378,424.9 | 487,002.9 | 626,734.1 | 806,557.1 |
| Total Cash, percent | .0 | .0 | .0 | .0 | .0 | .0 | .0 | .0 | .0 | .0 |
| Account Receivables | 57,028.0 | 82,155.0 | 102,152.0 | 88,855.0 | 113,031.0 | 178,476.3 | 229,684.8 | 295,586.2 | 380,396.0 | 489,539.5 |
| Account Receivables, % | 18.23 | 19.71 | 18.24 | 18.26 | 14.5 | 17.79 | 17.79 | 17.79 | 17.79 | 17.79 |
| Inventories | 64,340.0 | 95,013.0 | 169,082.0 | 204,389.0 | 209,707.0 | 285,875.0 | 367,898.4 | 473,456.1 | 609,300.5 | 784,121.5 |
| Inventories, % | 20.57 | 22.79 | 30.18 | 42.01 | 26.9 | 28.49 | 28.49 | 28.49 | 28.49 | 28.49 |
| Accounts Payable | 35,902.0 | 45,546.0 | 59,179.0 | 44,211.0 | 70,875.0 | 102,638.7 | 132,087.9 | 169,986.6 | 218,759.3 | 281,525.9 |
| Accounts Payable, % | 11.48 | 10.92 | 10.56 | 9.09 | 9.09 | 10.23 | 10.23 | 10.23 | 10.23 | 10.23 |
| Capital Expenditure | -13,277.0 | -18,219.0 | -23,588.0 | -20,543.0 | -17,414.0 | -38,694.9 | -49,797.2 | -64,085.1 | -82,472.5 | -106,135.5 |
| Capital Expenditure, % | -4.24 | -4.37 | -4.21 | -4.22 | -2.23 | -3.86 | -3.86 | -3.86 | -3.86 | -3.86 |
| Tax Rate, % | 28.29 | 28.29 | 28.29 | 28.29 | 28.29 | 28.29 | 28.29 | 28.29 | 28.29 | 28.29 |
| EBITAT | 71,666.6 | 87,510.4 | 130,942.1 | 63,370.5 | 164,964.5 | 205,821.4 | 264,875.8 | 340,874.2 | 438,678.0 | 564,543.9 |
| Depreciation | ||||||||||
| Changes in Account Receivables | ||||||||||
| Changes in Inventories | ||||||||||
| Changes in Accounts Payable | ||||||||||
| Capital Expenditure | ||||||||||
| UFCF | -15,320.4 | 38,103.4 | 48,317.1 | 31,953.5 | 171,795.5 | 97,426.3 | 162,964.7 | 209,722.7 | 269,896.4 | 347,335.3 |
| WACC, % | 7.12 | 7.11 | 7.11 | 7.11 | 7.11 | 7.11 | 7.11 | 7.11 | 7.11 | 7.11 |
| PV UFCF | ||||||||||
| SUM PV UFCF | 855,041.4 | |||||||||
| Long Term Growth Rate, % | 3.00 | |||||||||
| Free cash flow (T + 1) | 357,755 | |||||||||
| Terminal Value | 8,699,203 | |||||||||
| Present Terminal Value | 6,169,906 | |||||||||
| Enterprise Value | 7,024,948 | |||||||||
| Net Debt | -169,041 | |||||||||
| Equity Value | 7,193,989 | |||||||||
| Diluted Shares Outstanding, MM | 739 | |||||||||
| Equity Value Per Share | 9,730.67 |
What You Will Receive
- Authentic Advantest Data: Preloaded financial information – from revenue to EBIT – based on real and projected figures.
- Comprehensive Customization: Modify all essential parameters (yellow cells) such as WACC, growth %, and tax rates.
- Immediate Valuation Updates: Automatic recalculations to assess the impact of changes on Advantest’s fair value.
- Flexible Excel Template: Designed for quick modifications, scenario analysis, and thorough projections.
- Efficient and Precise: Eliminate the need to build models from the ground up while ensuring accuracy and adaptability.
Key Features
- Customizable Forecast Inputs: Adjust vital parameters such as revenue growth, EBITDA margin, and capital investments.
- Instant DCF Valuation: Quickly computes intrinsic value, net present value (NPV), and various financial metrics.
- High-Precision Accuracy: Leverages Advantest's real-world financial data for authentic valuation results.
- Effortless Scenario Analysis: Evaluate different assumptions and easily compare potential outcomes.
- Efficiency Boost: Remove the hassle of creating intricate valuation models from the ground up.
How It Operates
- Download: Obtain the pre-configured Excel file featuring Advantest Corporation’s (6857T) financial data.
- Customize: Modify projections, such as revenue growth, EBITDA percentage, and WACC.
- Real-Time Updates: The intrinsic value and NPV calculations refresh automatically as you make changes.
- Scenario Testing: Develop various projections and instantly analyze the different outcomes.
- Informed Decision-Making: Leverage the valuation results to shape your investment approach.
Why Choose This Calculator for Advantest Corporation (6857T)?
- Precision: Utilizes authentic Advantest financial data for reliable results.
- Versatility: Allows users to easily experiment and adjust inputs as needed.
- Efficiency: Eliminate the burden of constructing a DCF model from the ground up.
- Expert-Level: Crafted with the accuracy and usability that CFOs demand.
- Intuitive: Simple to navigate, suitable for users without extensive financial modeling expertise.
Who Can Benefit from This Product?
- Individual Investors: Gain the insights needed for making informed decisions regarding Advantest Corporation (6857T) stock.
- Financial Analysts: Enhance valuation processes with easy-to-use financial models tailored for Advantest Corporation (6857T).
- Consultants: Provide clients with precise valuation insights on Advantest Corporation (6857T) in a timely manner.
- Business Owners: Learn how valuation for major firms like Advantest Corporation (6857T) can inform your own business strategies.
- Finance Students: Explore valuation techniques by analyzing real-world data and situations related to Advantest Corporation (6857T).
Contents of the Template
- Pre-Filled DCF Model: Advantest Corporation's (6857T) financial data ready for immediate utilization.
- WACC Calculator: Comprehensive calculations for the Weighted Average Cost of Capital.
- Financial Ratios: Assess Advantest's profitability, leverage, and operational efficiency.
- Editable Inputs: Modify assumptions like growth rates, profit margins, and capital expenditures to tailor your scenarios.
- Financial Statements: Access to annual and quarterly reports for in-depth analysis.
- Interactive Dashboard: Effortlessly visualize essential valuation metrics and outcomes.
Disclaimer
All information, articles, and product details provided on this website are for general informational and educational purposes only. We do not claim any ownership over, nor do we intend to infringe upon, any trademarks, copyrights, logos, brand names, or other intellectual property mentioned or depicted on this site. Such intellectual property remains the property of its respective owners, and any references here are made solely for identification or informational purposes, without implying any affiliation, endorsement, or partnership.
We make no representations or warranties, express or implied, regarding the accuracy, completeness, or suitability of any content or products presented. Nothing on this website should be construed as legal, tax, investment, financial, medical, or other professional advice. In addition, no part of this site—including articles or product references—constitutes a solicitation, recommendation, endorsement, advertisement, or offer to buy or sell any securities, franchises, or other financial instruments, particularly in jurisdictions where such activity would be unlawful.
All content is of a general nature and may not address the specific circumstances of any individual or entity. It is not a substitute for professional advice or services. Any actions you take based on the information provided here are strictly at your own risk. You accept full responsibility for any decisions or outcomes arising from your use of this website and agree to release us from any liability in connection with your use of, or reliance upon, the content or products found herein.