
|
Suzhou Hyc Technology Co., Ltd. (688001.SS) DCF -Bewertung |
Fully Editable: Tailor To Your Needs In Excel Or Sheets
Professional Design: Trusted, Industry-Standard Templates
Investor-Approved Valuation Models
MAC/PC Compatible, Fully Unlocked
No Expertise Is Needed; Easy To Follow
Suzhou HYC Technology Co.,Ltd. (688001.SS) Bundle
Entdecken Sie das wahre Potenzial von Suzhou Hyc Technology Co., Ltd., mit unserem DCF-Taschenrechner von professionellem Qualitätsqualität! Passen Sie wichtige Annahmen an, experimentieren Sie mit verschiedenen Szenarien und untersuchen Sie die Auswirkungen von Änderungen auf die Bewertung der Suzhou Hyc Technology Co., Ltd. - alles innerhalb einer einzelnen Excel -Vorlage.
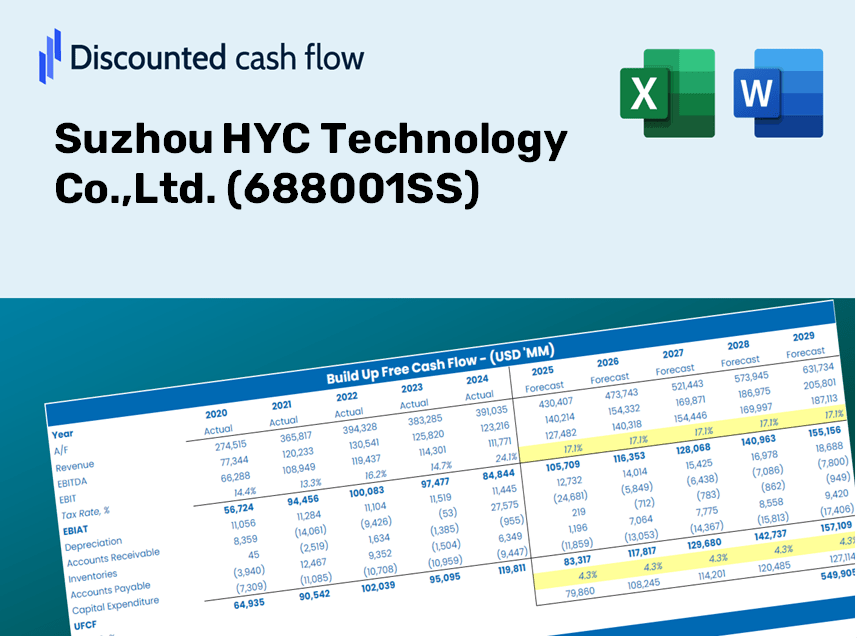
Discounted Cash Flow (DCF) - (USD MM)
| Year | AY1 2020 |
AY2 2021 |
AY3 2022 |
AY4 2023 |
AY5 2024 |
FY1 2025 |
FY2 2026 |
FY3 2027 |
FY4 2028 |
FY5 2029 |
|---|---|---|---|---|---|---|---|---|---|---|
| Revenue | 1,677.5 | 2,020.2 | 2,320.0 | 1,861.0 | 1,822.6 | 1,883.7 | 1,946.9 | 2,012.2 | 2,079.7 | 2,149.5 |
| Revenue Growth, % | 0 | 20.43 | 14.84 | -19.78 | -2.07 | 3.35 | 3.35 | 3.35 | 3.35 | 3.35 |
| EBITDA | 308.4 | 359.1 | 345.2 | 286.7 | -71.2 | 235.6 | 243.5 | 251.7 | 260.1 | 268.8 |
| EBITDA, % | 18.38 | 17.78 | 14.88 | 15.41 | -3.91 | 12.51 | 12.51 | 12.51 | 12.51 | 12.51 |
| Depreciation | 49.1 | 61.3 | 68.5 | 98.2 | 146.0 | 83.6 | 86.4 | 89.3 | 92.3 | 95.4 |
| Depreciation, % | 2.93 | 3.03 | 2.95 | 5.28 | 8.01 | 4.44 | 4.44 | 4.44 | 4.44 | 4.44 |
| EBIT | 259.2 | 297.8 | 276.7 | 188.5 | -217.2 | 152.0 | 157.1 | 162.3 | 167.8 | 173.4 |
| EBIT, % | 15.45 | 14.74 | 11.93 | 10.13 | -11.92 | 8.07 | 8.07 | 8.07 | 8.07 | 8.07 |
| Total Cash | 1,148.0 | 1,813.0 | 1,645.8 | 874.2 | 527.2 | 1,149.1 | 1,187.7 | 1,227.5 | 1,268.7 | 1,311.3 |
| Total Cash, percent | .0 | .0 | .0 | .0 | .0 | .0 | .0 | .0 | .0 | .0 |
| Account Receivables | 886.2 | 1,115.6 | 1,296.0 | 1,255.2 | 1,547.1 | 1,191.4 | 1,231.4 | 1,272.7 | 1,315.4 | 1,359.5 |
| Account Receivables, % | 52.83 | 55.22 | 55.86 | 67.45 | 84.88 | 63.25 | 63.25 | 63.25 | 63.25 | 63.25 |
| Inventories | 256.5 | 494.7 | 525.7 | 629.7 | 783.5 | 524.7 | 542.3 | 560.5 | 579.3 | 598.7 |
| Inventories, % | 15.29 | 24.49 | 22.66 | 33.84 | 42.99 | 27.85 | 27.85 | 27.85 | 27.85 | 27.85 |
| Accounts Payable | 324.8 | 631.3 | 608.6 | 560.9 | 603.6 | 527.8 | 545.5 | 563.8 | 582.7 | 602.3 |
| Accounts Payable, % | 19.36 | 31.25 | 26.23 | 30.14 | 33.12 | 28.02 | 28.02 | 28.02 | 28.02 | 28.02 |
| Capital Expenditure | -111.8 | -318.4 | -367.4 | -505.5 | -200.9 | -288.0 | -297.7 | -307.7 | -318.0 | -328.6 |
| Capital Expenditure, % | -6.66 | -15.76 | -15.84 | -27.16 | -11.02 | -15.29 | -15.29 | -15.29 | -15.29 | -15.29 |
| Tax Rate, % | -1.66 | -1.66 | -1.66 | -1.66 | -1.66 | -1.66 | -1.66 | -1.66 | -1.66 | -1.66 |
| EBITAT | 236.6 | 294.2 | 275.3 | 185.0 | -220.8 | 148.2 | 153.2 | 158.3 | 163.6 | 169.1 |
| Depreciation | ||||||||||
| Changes in Account Receivables | ||||||||||
| Changes in Inventories | ||||||||||
| Changes in Accounts Payable | ||||||||||
| Capital Expenditure | ||||||||||
| UFCF | -644.0 | -124.1 | -257.7 | -333.1 | -678.8 | 482.5 | -97.9 | -101.2 | -104.6 | -108.1 |
| WACC, % | 6.7 | 6.72 | 6.73 | 6.72 | 6.73 | 6.72 | 6.72 | 6.72 | 6.72 | 6.72 |
| PV UFCF | ||||||||||
| SUM PV UFCF | 124.2 | |||||||||
| Long Term Growth Rate, % | 4.00 | |||||||||
| Free cash flow (T + 1) | -112 | |||||||||
| Terminal Value | -4,135 | |||||||||
| Present Terminal Value | -2,987 | |||||||||
| Enterprise Value | -2,863 | |||||||||
| Net Debt | 499 | |||||||||
| Equity Value | -3,361 | |||||||||
| Diluted Shares Outstanding, MM | 443 | |||||||||
| Equity Value Per Share | -7.59 |
What You Will Receive
- Comprehensive HYC Financial Data: Pre-loaded with Suzhou HYC Technology Co., Ltd.'s historical and forecasted financials for insightful analysis.
- Customizable Template: Easily adjust essential parameters such as revenue growth, WACC, and EBITDA percentage.
- Real-Time Calculations: Instantly view updates to HYC’s intrinsic value as you modify inputs.
- Expert Valuation Tool: Crafted for investors, analysts, and consultants aiming for precise DCF outcomes.
- Intuitive Design: User-friendly layout with straightforward guidance suitable for all skill levels.
Key Features
- Authentic Financial Data for Suzhou HYC Technology: Pre-loaded with historical financial performance and future forecasts for Suzhou HYC Technology Co., Ltd. (688001SS).
- Completely Customizable Parameters: Tailor inputs for revenue growth, profit margins, discount rates, tax rates, and capital expenditures to fit your analysis.
- Interactive Valuation Framework: Automatic recalculations of Net Present Value (NPV) and intrinsic value driven by your customized inputs.
- Multiple Scenario Analysis: Develop various forecasting scenarios to evaluate differing valuation results.
- Intuitive User Experience: Designed for ease of use, catering to both seasoned professionals and newcomers.
How It Works
- Download: Obtain the pre-loaded Excel file containing Suzhou HYC Technology Co., Ltd.'s (688001SS) financial data.
- Customize: Modify forecasts such as revenue growth, EBITDA %, and WACC to suit your analysis.
- Update Automatically: Watch as the intrinsic value and NPV calculations refresh in real-time.
- Test Scenarios: Generate various projections and easily compare results side by side.
- Make Decisions: Leverage the valuation findings to inform your investment approach.
Why Opt for HYC Technology's Calculator?
- Precise Financial Insights: Utilize accurate data from Suzhou HYC Technology Co., Ltd. for trustworthy valuation outcomes.
- Flexible Adjustments: Modify key variables such as growth rates, WACC, and tax rates according to your forecasts.
- Efficient Use of Time: Pre-configured calculations save you the hassle of starting from the ground up.
- Expert-Level Instrument: Tailored for investors, analysts, and industry consultants in mind.
- Intuitive Design: Easy-to-navigate interface and comprehensive instructions cater to users of all experience levels.
Who Can Benefit from Suzhou HYC Technology Co.,Ltd. (688001SS)?
- Individual Investors: Gain insights to make informed choices regarding investments in Suzhou HYC Technology (688001SS).
- Financial Analysts: Enhance valuation tasks with comprehensive financial models tailored for Suzhou HYC Technology (688001SS).
- Consultants: Provide clients with swift and precise valuation analysis of Suzhou HYC Technology (688001SS).
- Business Owners: Learn from the valuation strategies of established firms like Suzhou HYC Technology (688001SS) to inform your own business decisions.
- Finance Students: Explore practical valuation methods utilizing real data and case studies relevant to Suzhou HYC Technology (688001SS).
Contents of the Template
- Operating and Balance Sheet Data: Pre-filled historical data and forecasts for Suzhou HYC Technology Co., Ltd. (688001SS), including revenue, EBITDA, EBIT, and capital expenditures.
- WACC Calculation: A dedicated sheet for calculating the Weighted Average Cost of Capital (WACC), featuring key parameters such as Beta, risk-free rate, and share price.
- DCF Valuation (Unlevered and Levered): Editable Discounted Cash Flow models that present intrinsic value along with comprehensive calculations.
- Financial Statements: Pre-loaded financial statements (both annual and quarterly) to facilitate in-depth analysis.
- Key Ratios: Includes profitability, leverage, and efficiency ratios specific to Suzhou HYC Technology Co., Ltd. (688001SS).
- Dashboard and Charts: A visual summary of valuation outputs and assumptions for straightforward result analysis.
Disclaimer
All information, articles, and product details provided on this website are for general informational and educational purposes only. We do not claim any ownership over, nor do we intend to infringe upon, any trademarks, copyrights, logos, brand names, or other intellectual property mentioned or depicted on this site. Such intellectual property remains the property of its respective owners, and any references here are made solely for identification or informational purposes, without implying any affiliation, endorsement, or partnership.
We make no representations or warranties, express or implied, regarding the accuracy, completeness, or suitability of any content or products presented. Nothing on this website should be construed as legal, tax, investment, financial, medical, or other professional advice. In addition, no part of this site—including articles or product references—constitutes a solicitation, recommendation, endorsement, advertisement, or offer to buy or sell any securities, franchises, or other financial instruments, particularly in jurisdictions where such activity would be unlawful.
All content is of a general nature and may not address the specific circumstances of any individual or entity. It is not a substitute for professional advice or services. Any actions you take based on the information provided here are strictly at your own risk. You accept full responsibility for any decisions or outcomes arising from your use of this website and agree to release us from any liability in connection with your use of, or reliance upon, the content or products found herein.