
|
Bozhon Precision Industry Technology Co., Ltd (688097.SS) DCF -Bewertung |
Fully Editable: Tailor To Your Needs In Excel Or Sheets
Professional Design: Trusted, Industry-Standard Templates
Investor-Approved Valuation Models
MAC/PC Compatible, Fully Unlocked
No Expertise Is Needed; Easy To Follow
BOZHON Precision Industry Technology Co.,Ltd (688097.SS) Bundle
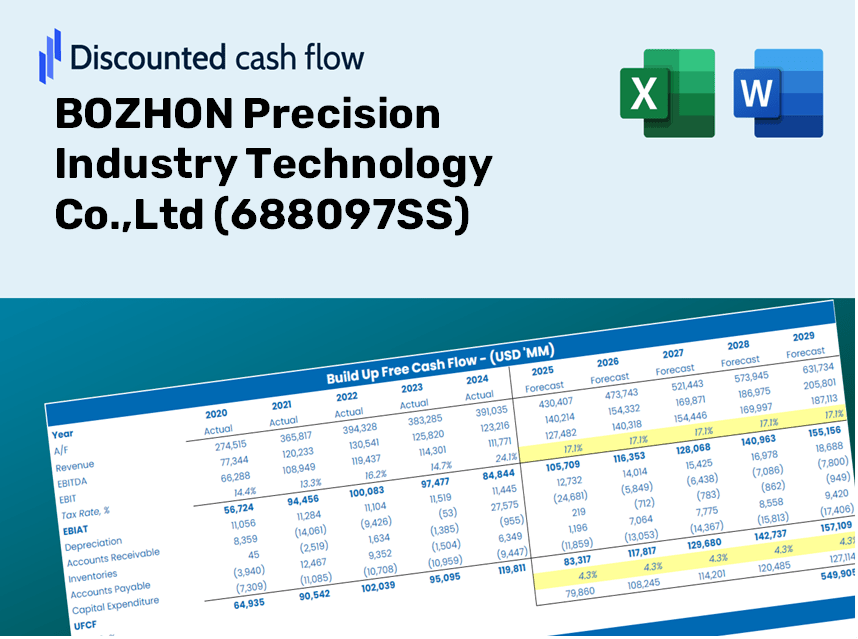
Gewinnen Sie einen Einblick in Ihre BOZHON PRECISION Industry Technology Co., Ltd (688097SS) Bewertungsanalyse mit unserem ausgeklügelten DCF -Taschenrechner! Diese Excel -Vorlage wird mit realen (688097) Daten vorinstalliert, sodass Sie Prognosen und Annahmen anpassen können, um den intrinsischen Wert der Bozhon Precision Industry Technology Co., Ltd., genau zu bestimmen.
Discounted Cash Flow (DCF) - (USD MM)
| Year | AY1 2020 |
AY2 2021 |
AY3 2022 |
AY4 2023 |
AY5 2024 |
FY1 2025 |
FY2 2026 |
FY3 2027 |
FY4 2028 |
FY5 2029 |
|---|---|---|---|---|---|---|---|---|---|---|
| Revenue | 2,596.9 | 3,827.1 | 4,811.5 | 4,839.9 | 4,954.2 | 5,896.1 | 7,017.0 | 8,351.1 | 9,938.7 | 11,828.2 |
| Revenue Growth, % | 0 | 47.37 | 25.72 | 0.58904 | 2.36 | 19.01 | 19.01 | 19.01 | 19.01 | 19.01 |
| EBITDA | 338.8 | 236.8 | 436.0 | 429.9 | 452.6 | 546.1 | 649.9 | 773.5 | 920.5 | 1,095.5 |
| EBITDA, % | 13.04 | 6.19 | 9.06 | 8.88 | 9.14 | 9.26 | 9.26 | 9.26 | 9.26 | 9.26 |
| Depreciation | 53.1 | 60.4 | 75.7 | 79.8 | 78.8 | 99.5 | 118.4 | 140.9 | 167.7 | 199.5 |
| Depreciation, % | 2.04 | 1.58 | 1.57 | 1.65 | 1.59 | 1.69 | 1.69 | 1.69 | 1.69 | 1.69 |
| EBIT | 285.7 | 176.4 | 360.3 | 350.1 | 373.8 | 446.6 | 531.6 | 632.6 | 752.9 | 896.0 |
| EBIT, % | 11 | 4.61 | 7.49 | 7.23 | 7.55 | 7.58 | 7.58 | 7.58 | 7.58 | 7.58 |
| Total Cash | 761.2 | 525.8 | 1,428.3 | 1,324.1 | 981.9 | 1,414.1 | 1,682.9 | 2,002.9 | 2,383.6 | 2,836.8 |
| Total Cash, percent | .0 | .0 | .0 | .0 | .0 | .0 | .0 | .0 | .0 | .0 |
| Account Receivables | 1,424.5 | 1,731.0 | 2,204.8 | 2,703.2 | 3,654.4 | 3,249.0 | 3,866.7 | 4,601.9 | 5,476.8 | 6,518.0 |
| Account Receivables, % | 54.85 | 45.23 | 45.82 | 55.85 | 73.76 | 55.11 | 55.11 | 55.11 | 55.11 | 55.11 |
| Inventories | 1,233.6 | 2,216.3 | 2,710.7 | 2,434.9 | 2,697.4 | 3,142.7 | 3,740.2 | 4,451.3 | 5,297.6 | 6,304.7 |
| Inventories, % | 47.5 | 57.91 | 56.34 | 50.31 | 54.45 | 53.3 | 53.3 | 53.3 | 53.3 | 53.3 |
| Accounts Payable | 1,072.0 | 1,333.8 | 1,594.3 | 1,357.0 | 2,296.5 | 2,165.7 | 2,577.5 | 3,067.5 | 3,650.7 | 4,344.7 |
| Accounts Payable, % | 41.28 | 34.85 | 33.13 | 28.04 | 46.36 | 36.73 | 36.73 | 36.73 | 36.73 | 36.73 |
| Capital Expenditure | -222.9 | -269.0 | -131.3 | -100.7 | -194.2 | -287.0 | -341.6 | -406.5 | -483.8 | -575.8 |
| Capital Expenditure, % | -8.59 | -7.03 | -2.73 | -2.08 | -3.92 | -4.87 | -4.87 | -4.87 | -4.87 | -4.87 |
| Tax Rate, % | 5.2 | 5.2 | 5.2 | 5.2 | 5.2 | 5.2 | 5.2 | 5.2 | 5.2 | 5.2 |
| EBITAT | 241.1 | 175.7 | 314.2 | 335.7 | 354.4 | 412.6 | 491.0 | 584.4 | 695.5 | 827.7 |
| Depreciation | ||||||||||
| Changes in Account Receivables | ||||||||||
| Changes in Inventories | ||||||||||
| Changes in Accounts Payable | ||||||||||
| Capital Expenditure | ||||||||||
| UFCF | -1,514.9 | -1,060.3 | -449.1 | -145.1 | -35.2 | 54.3 | -535.6 | -637.5 | -758.6 | -902.9 |
| WACC, % | 6.49 | 6.55 | 6.5 | 6.54 | 6.53 | 6.52 | 6.52 | 6.52 | 6.52 | 6.52 |
| PV UFCF | ||||||||||
| SUM PV UFCF | -2,196.0 | |||||||||
| Long Term Growth Rate, % | 2.00 | |||||||||
| Free cash flow (T + 1) | -921 | |||||||||
| Terminal Value | -20,365 | |||||||||
| Present Terminal Value | -14,849 | |||||||||
| Enterprise Value | -17,045 | |||||||||
| Net Debt | 216 | |||||||||
| Equity Value | -17,260 | |||||||||
| Diluted Shares Outstanding, MM | 447 | |||||||||
| Equity Value Per Share | -38.65 |
What You Will Receive
- Genuine BOZHON Data: Comprehensive financials – from revenue to EBIT – derived from actual and projected metrics.
- Comprehensive Customization: Modify all essential parameters (yellow cells) such as WACC, growth %, and tax rates.
- Immediate Valuation Adjustments: Automatic recalculations to assess the influence of changes on BOZHON's fair value.
- Flexible Excel Template: Designed for swift modifications, scenario analysis, and in-depth forecasts.
- Efficient and Precise: Eliminate the need to construct models from the ground up while ensuring accuracy and adaptability.
Key Features
- Comprehensive BOZHON Data: Comes equipped with historical financials and future projections specific to BOZHON Precision Industry Technology Co., Ltd (688097SS).
- Fully Adjustable Parameters: Tailor revenue growth, profit margins, WACC, tax rates, and capital expenditure figures to fit your analysis.
- Adaptive Valuation Framework: Instantaneous recalculations of Net Present Value (NPV) and intrinsic value based on your specified inputs.
- Multi-Scenario Analysis: Develop various forecast scenarios to explore diverse valuation results.
- Intuitive User Interface: Clean and organized layout, perfect for both seasoned professionals and newcomers.
How It Operates
- 1. Access the Template: Download and open the Excel file containing BOZHON Precision Industry Technology Co.,Ltd’s preloaded data.
- 2. Adjust Assumptions: Modify key inputs such as growth rates, WACC, and capital expenditures as needed.
- 3. Instant Results: The DCF model promptly calculates the intrinsic value and NPV based on your inputs.
- 4. Analyze Scenarios: Explore various forecasts to assess different valuation possibilities.
- 5. Present with Assurance: Deliver professional valuation insights to back your decision-making process.
Why Opt for This Calculator?
- User-Friendly: Tailored for both novices and seasoned professionals.
- Customizable Inputs: Easily adjust parameters to suit your analytical needs.
- Real-Time Updates: Observe immediate changes to BOZHON's valuation as you modify inputs.
- Pre-Configured: Comes with BOZHON's actual financial data for swift analysis.
- Endorsed by Experts: Utilized by investors and analysts for well-informed decision-making.
Who Can Benefit from This Product?
- Investors: Assess the valuation of BOZHON Precision Industry Technology Co., Ltd (688097SS) prior to making investment decisions.
- CFOs and Financial Analysts: Enhance valuation methodologies and verify financial projections.
- Startup Founders: Gain insights into the valuation practices of established companies such as BOZHON.
- Consultants: Provide expert valuation assessments and reports for clients.
- Students and Educators: Utilize real-time data for practicing and instructing valuation strategies.
What the Template Includes
- Historical Data: Contains BOZHON Precision Industry Technology Co., Ltd.'s past financials and baseline forecasts.
- DCF and Levered DCF Models: Comprehensive templates to assess the intrinsic value of BOZHON (688097SS).
- WACC Sheet: Pre-configured calculations for Weighted Average Cost of Capital.
- Editable Inputs: Adjust key drivers such as growth rates, EBITDA %, and CAPEX assumptions as needed.
- Quarterly and Annual Statements: A detailed analysis of BOZHON's financial performance.
- Interactive Dashboard: Dynamically visualize valuation results and future projections.
Disclaimer
All information, articles, and product details provided on this website are for general informational and educational purposes only. We do not claim any ownership over, nor do we intend to infringe upon, any trademarks, copyrights, logos, brand names, or other intellectual property mentioned or depicted on this site. Such intellectual property remains the property of its respective owners, and any references here are made solely for identification or informational purposes, without implying any affiliation, endorsement, or partnership.
We make no representations or warranties, express or implied, regarding the accuracy, completeness, or suitability of any content or products presented. Nothing on this website should be construed as legal, tax, investment, financial, medical, or other professional advice. In addition, no part of this site—including articles or product references—constitutes a solicitation, recommendation, endorsement, advertisement, or offer to buy or sell any securities, franchises, or other financial instruments, particularly in jurisdictions where such activity would be unlawful.
All content is of a general nature and may not address the specific circumstances of any individual or entity. It is not a substitute for professional advice or services. Any actions you take based on the information provided here are strictly at your own risk. You accept full responsibility for any decisions or outcomes arising from your use of this website and agree to release us from any liability in connection with your use of, or reliance upon, the content or products found herein.