
|
China National Electric Apparat Research Institute Co., Ltd. (688128.SS) DCF -Bewertung |
Fully Editable: Tailor To Your Needs In Excel Or Sheets
Professional Design: Trusted, Industry-Standard Templates
Investor-Approved Valuation Models
MAC/PC Compatible, Fully Unlocked
No Expertise Is Needed; Easy To Follow
China National Electric Apparatus Research Institute Co., Ltd. (688128.SS) Bundle
Egal, ob Sie ein Investor oder Analyst sind, dieser DCF -Taschenrechner (688128S) ist Ihre wesentliche Ressource für eine genaue Bewertung. Ausgestattet mit realen Daten des China National Electric Apparatus Research Institute Institute Co., Ltd. können Sie Prognosen anpassen und die Auswirkungen in Echtzeit beobachten.
Discounted Cash Flow (DCF) - (USD MM)
| Year | AY1 2020 |
AY2 2021 |
AY3 2022 |
AY4 2023 |
AY5 2024 |
FY1 2025 |
FY2 2026 |
FY3 2027 |
FY4 2028 |
FY5 2029 |
|---|---|---|---|---|---|---|---|---|---|---|
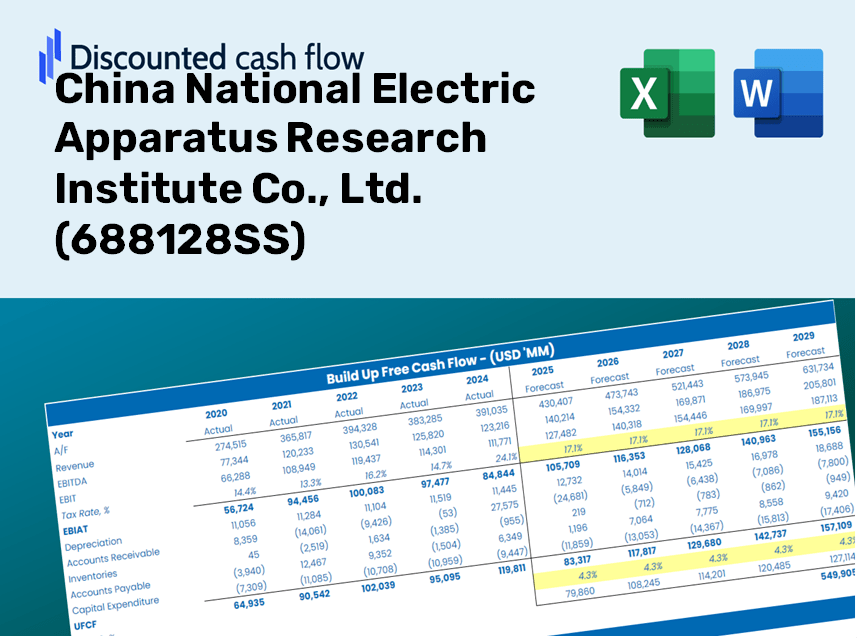
| Revenue | 2,519.6 | 3,407.5 | 3,794.5 | 4,172.8 | 4,522.7 | 5,257.1 | 6,110.7 | 7,102.9 | 8,256.2 | 9,596.8 |
| Revenue Growth, % | 0 | 35.24 | 11.36 | 9.97 | 8.39 | 16.24 | 16.24 | 16.24 | 16.24 | 16.24 |
| EBITDA | 302.3 | 334.6 | 386.4 | 495.7 | 555.1 | 590.4 | 686.2 | 797.7 | 927.2 | 1,077.7 |
| EBITDA, % | 12 | 9.82 | 10.18 | 11.88 | 12.27 | 11.23 | 11.23 | 11.23 | 11.23 | 11.23 |
| Depreciation | 68.6 | 78.4 | 87.5 | 109.2 | 128.0 | 134.4 | 156.2 | 181.5 | 211.0 | 245.3 |
| Depreciation, % | 2.72 | 2.3 | 2.3 | 2.62 | 2.83 | 2.56 | 2.56 | 2.56 | 2.56 | 2.56 |
| EBIT | 233.6 | 256.2 | 299.0 | 386.5 | 427.1 | 456.0 | 530.1 | 616.1 | 716.2 | 832.5 |
| EBIT, % | 9.27 | 7.52 | 7.88 | 9.26 | 9.44 | 8.67 | 8.67 | 8.67 | 8.67 | 8.67 |
| Total Cash | 1,486.2 | 1,036.6 | 1,103.9 | 1,016.1 | 1,057.6 | 1,747.8 | 2,031.6 | 2,361.4 | 2,744.9 | 3,190.6 |
| Total Cash, percent | .0 | .0 | .0 | .0 | .0 | .0 | .0 | .0 | .0 | .0 |
| Account Receivables | 938.2 | 1,410.3 | 1,630.4 | 1,757.4 | 1,863.3 | 2,154.4 | 2,504.2 | 2,910.9 | 3,383.5 | 3,932.9 |
| Account Receivables, % | 37.24 | 41.39 | 42.97 | 42.12 | 41.2 | 40.98 | 40.98 | 40.98 | 40.98 | 40.98 |
| Inventories | 511.0 | 918.8 | 1,601.6 | 2,514.6 | 2,260.9 | 2,099.7 | 2,440.7 | 2,837.0 | 3,297.6 | 3,833.1 |
| Inventories, % | 20.28 | 26.97 | 42.21 | 60.26 | 49.99 | 39.94 | 39.94 | 39.94 | 39.94 | 39.94 |
| Accounts Payable | 671.3 | 383.0 | 1,300.5 | 1,242.4 | 1,003.6 | 1,305.0 | 1,516.9 | 1,763.2 | 2,049.5 | 2,382.3 |
| Accounts Payable, % | 26.64 | 11.24 | 34.27 | 29.77 | 22.19 | 24.82 | 24.82 | 24.82 | 24.82 | 24.82 |
| Capital Expenditure | -162.2 | -146.6 | -182.1 | -243.3 | -213.7 | -274.4 | -318.9 | -370.7 | -430.9 | -500.9 |
| Capital Expenditure, % | -6.44 | -4.3 | -4.8 | -5.83 | -4.72 | -5.22 | -5.22 | -5.22 | -5.22 | -5.22 |
| Tax Rate, % | 11.58 | 11.58 | 11.58 | 11.58 | 11.58 | 11.58 | 11.58 | 11.58 | 11.58 | 11.58 |
| EBITAT | 213.8 | 229.4 | 284.2 | 349.1 | 377.6 | 414.9 | 482.2 | 560.5 | 651.6 | 757.3 |
| Depreciation | ||||||||||
| Changes in Account Receivables | ||||||||||
| Changes in Inventories | ||||||||||
| Changes in Accounts Payable | ||||||||||
| Capital Expenditure | ||||||||||
| UFCF | -657.7 | -1,007.0 | 204.2 | -883.1 | 201.0 | 446.3 | -159.4 | -185.3 | -215.3 | -250.3 |
| WACC, % | 4.71 | 4.71 | 4.71 | 4.71 | 4.7 | 4.71 | 4.71 | 4.71 | 4.71 | 4.71 |
| PV UFCF | ||||||||||
| SUM PV UFCF | -258.6 | |||||||||
| Long Term Growth Rate, % | 3.00 | |||||||||
| Free cash flow (T + 1) | -258 | |||||||||
| Terminal Value | -15,112 | |||||||||
| Present Terminal Value | -12,008 | |||||||||
| Enterprise Value | -12,267 | |||||||||
| Net Debt | -884 | |||||||||
| Equity Value | -11,383 | |||||||||
| Diluted Shares Outstanding, MM | 406 | |||||||||
| Equity Value Per Share | -28.03 |
What You Will Receive
- Authentic Financial Data: Comprehensive financials – encompassing revenue to EBIT – based on actual and projected metrics.
- Complete Customization: Modify all essential parameters (yellow cells) such as WACC, growth %, and tax rates.
- Immediate Valuation Adjustments: Automatic updates to assess the effects of changes on the fair value of China National Electric Apparatus Research Institute Co., Ltd. (688128SS).
- Flexible Excel Template: Designed for quick modifications, scenario analysis, and in-depth forecasts.
- Efficient and Reliable: Avoid building models from the ground up while ensuring accuracy and adaptability.
Key Features
- Verified Financial Data: Gain access to reliable, pre-loaded historical performance and future forecasts for China National Electric Apparatus Research Institute Co., Ltd. (688128SS).
- Flexible Projection Inputs: Modify highlighted cells to adjust variables such as WACC, growth rates, and profit margins.
- Real-Time Calculations: Automatic updates for DCF, Net Present Value (NPV), and cash flow analyses.
- Interactive Dashboard: User-friendly charts and summaries to effectively visualize your valuation outcomes.
- Suitable for All Levels: A straightforward and intuitive design tailored for investors, CFOs, and financial consultants.
How It Functions
- Obtain the Template: Gain immediate access to the Excel-based CNEAR DCF Calculator for China National Electric Apparatus Research Institute Co., Ltd. (688128SS).
- Enter Your Assumptions: Modify the yellow-highlighted cells to input your forecasts for growth rates, WACC, margins, and more.
- Real-Time Calculations: The model will automatically refresh to display CNEAR's intrinsic value.
- Evaluate Scenarios: Test various assumptions to assess potential changes in valuation.
- Analyze and Conclude: Utilize the results to inform your investment or financial assessment.
Why Select This Calculator for China National Electric Apparatus Research Institute Co., Ltd. (688128SS)?
- All-in-One Solution: Combines DCF, WACC, and financial ratio analyses into a single comprehensive tool.
- Flexible Input Options: Modify the highlighted cells to explore different financial scenarios.
- Thorough Analysis: Automatically computes the intrinsic value and Net Present Value for the company.
- Preloaded Financial Data: Access to historical and projected data for precise calculations.
- High-Quality Design: Perfect for financial professionals, investors, and business advisors.
Who Should Utilize This Product?
- Investors: Effectively assess the fair value of China National Electric Apparatus Research Institute Co., Ltd. (688128SS) prior to making investment choices.
- CFOs: Utilize a high-quality DCF model for accurate financial reporting and analysis.
- Consultants: Easily modify the template to create valuation reports tailored for clients.
- Entrepreneurs: Access valuable insights into the financial modeling practices of leading companies.
- Educators: Employ this tool to illustrate valuation methodologies in an educational context.
Contents of the Template
- Pre-Filled Data: Features historical financial information and forecasts for China National Electric Apparatus Research Institute Co., Ltd. (688128SS).
- Discounted Cash Flow Model: An editable DCF valuation model with automated calculations included.
- Weighted Average Cost of Capital (WACC): A dedicated worksheet for calculating WACC based on user-defined inputs.
- Key Financial Ratios: Evaluate the profitability, efficiency, and leverage of China National Electric Apparatus Research Institute Co., Ltd. (688128SS).
- Customizable Inputs: Easily modify revenue growth, margins, and tax rates.
- Clear Dashboard: Visuals and tables that summarize essential valuation outcomes.
Disclaimer
All information, articles, and product details provided on this website are for general informational and educational purposes only. We do not claim any ownership over, nor do we intend to infringe upon, any trademarks, copyrights, logos, brand names, or other intellectual property mentioned or depicted on this site. Such intellectual property remains the property of its respective owners, and any references here are made solely for identification or informational purposes, without implying any affiliation, endorsement, or partnership.
We make no representations or warranties, express or implied, regarding the accuracy, completeness, or suitability of any content or products presented. Nothing on this website should be construed as legal, tax, investment, financial, medical, or other professional advice. In addition, no part of this site—including articles or product references—constitutes a solicitation, recommendation, endorsement, advertisement, or offer to buy or sell any securities, franchises, or other financial instruments, particularly in jurisdictions where such activity would be unlawful.
All content is of a general nature and may not address the specific circumstances of any individual or entity. It is not a substitute for professional advice or services. Any actions you take based on the information provided here are strictly at your own risk. You accept full responsibility for any decisions or outcomes arising from your use of this website and agree to release us from any liability in connection with your use of, or reliance upon, the content or products found herein.