
|
Jiangsu Cai Qin Technology Co., Ltd (688182.SS) DCF -Bewertung |
Fully Editable: Tailor To Your Needs In Excel Or Sheets
Professional Design: Trusted, Industry-Standard Templates
Investor-Approved Valuation Models
MAC/PC Compatible, Fully Unlocked
No Expertise Is Needed; Easy To Follow
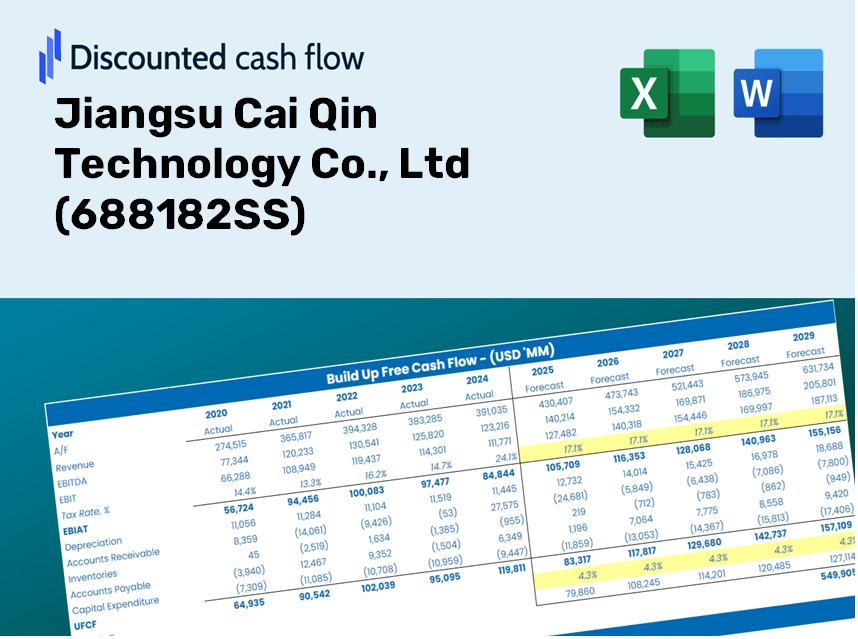
Jiangsu Cai Qin Technology Co., Ltd (688182.SS) Bundle
Möchten Sie den inneren Wert von Jiangsu Cai Qin Technology Co., Ltd. bestimmen? Unser DCF-Taschenrechner (688182S) integriert reale Daten mit umfangreichen Anpassungsfunktionen, sodass Sie Ihre Prognosen verfeinern und fundiertere Investitionsentscheidungen treffen können.
Discounted Cash Flow (DCF) - (USD MM)
| Year | AY1 2020 |
AY2 2021 |
AY3 2022 |
AY4 2023 |
AY5 2024 |
FY1 2025 |
FY2 2026 |
FY3 2027 |
FY4 2028 |
FY5 2029 |
|---|---|---|---|---|---|---|---|---|---|---|
| Revenue | 1,042.1 | 333.6 | 345.2 | 369.9 | 410.9 | 363.4 | 321.3 | 284.2 | 251.3 | 222.2 |
| Revenue Growth, % | 0 | -67.99 | 3.48 | 7.16 | 11.09 | -11.57 | -11.57 | -11.57 | -11.57 | -11.57 |
| EBITDA | 325.7 | 63.1 | 45.1 | 41.6 | 61.0 | 64.9 | 57.4 | 50.8 | 44.9 | 39.7 |
| EBITDA, % | 31.25 | 18.9 | 13.07 | 11.26 | 14.84 | 17.86 | 17.86 | 17.86 | 17.86 | 17.86 |
| Depreciation | 21.2 | 25.8 | 30.7 | 32.7 | 37.4 | 26.6 | 23.5 | 20.8 | 18.4 | 16.3 |
| Depreciation, % | 2.03 | 7.74 | 8.91 | 8.84 | 9.11 | 7.33 | 7.33 | 7.33 | 7.33 | 7.33 |
| EBIT | 304.5 | 37.2 | 14.4 | 8.9 | 23.5 | 38.3 | 33.9 | 29.9 | 26.5 | 23.4 |
| EBIT, % | 29.22 | 11.16 | 4.16 | 2.42 | 5.72 | 10.54 | 10.54 | 10.54 | 10.54 | 10.54 |
| Total Cash | 510.7 | 1,480.4 | 1,368.4 | 1,228.1 | 1,113.1 | 326.3 | 288.6 | 255.2 | 225.7 | 199.6 |
| Total Cash, percent | .0 | .0 | .0 | .0 | .0 | .0 | .0 | .0 | .0 | .0 |
| Account Receivables | 100.2 | 129.9 | 134.1 | 140.9 | 180.8 | 123.2 | 108.9 | 96.3 | 85.2 | 75.3 |
| Account Receivables, % | 9.62 | 38.94 | 38.85 | 38.08 | 43.99 | 33.9 | 33.9 | 33.9 | 33.9 | 33.9 |
| Inventories | 161.0 | 132.8 | 167.5 | 134.5 | 152.1 | 128.8 | 113.9 | 100.7 | 89.1 | 78.8 |
| Inventories, % | 15.45 | 39.82 | 48.54 | 36.36 | 37.01 | 35.44 | 35.44 | 35.44 | 35.44 | 35.44 |
| Accounts Payable | 62.3 | 92.3 | 145.9 | 156.6 | 260.2 | 132.0 | 116.7 | 103.2 | 91.3 | 80.7 |
| Accounts Payable, % | 5.98 | 27.68 | 42.28 | 42.35 | 63.33 | 36.32 | 36.32 | 36.32 | 36.32 | 36.32 |
| Capital Expenditure | -165.6 | -55.5 | -79.7 | -128.3 | -257.4 | -111.2 | -98.3 | -86.9 | -76.9 | -68.0 |
| Capital Expenditure, % | -15.89 | -16.65 | -23.1 | -34.69 | -62.65 | -30.6 | -30.6 | -30.6 | -30.6 | -30.6 |
| Tax Rate, % | 4.25 | 4.25 | 4.25 | 4.25 | 4.25 | 4.25 | 4.25 | 4.25 | 4.25 | 4.25 |
| EBITAT | 238.9 | 32.3 | 13.1 | 9.3 | 22.5 | 34.6 | 30.6 | 27.1 | 23.9 | 21.2 |
| Depreciation | ||||||||||
| Changes in Account Receivables | ||||||||||
| Changes in Inventories | ||||||||||
| Changes in Accounts Payable | ||||||||||
| Capital Expenditure | ||||||||||
| UFCF | -104.5 | 31.0 | -21.2 | -49.4 | -151.3 | -97.3 | -30.3 | -26.8 | -23.7 | -20.9 |
| WACC, % | 4.68 | 4.68 | 4.68 | 4.68 | 4.68 | 4.68 | 4.68 | 4.68 | 4.68 | 4.68 |
| PV UFCF | ||||||||||
| SUM PV UFCF | -180.3 | |||||||||
| Long Term Growth Rate, % | 2.00 | |||||||||
| Free cash flow (T + 1) | -21 | |||||||||
| Terminal Value | -796 | |||||||||
| Present Terminal Value | -633 | |||||||||
| Enterprise Value | -814 | |||||||||
| Net Debt | -244 | |||||||||
| Equity Value | -569 | |||||||||
| Diluted Shares Outstanding, MM | 413 | |||||||||
| Equity Value Per Share | -1.38 |
Benefits You Will Receive
- Pre-Configured Financial Model: Leverage Jiangsu Cai Qin Technology's actual data for accurate DCF valuations.
- Comprehensive Forecast Management: Modify revenue growth, profit margins, WACC, and other critical factors at your convenience.
- Real-Time Calculations: Automatic updates provide immediate insights as adjustments are made.
- Professional-Grade Template: An elegant Excel file tailored for high-quality valuation presentations.
- Flexible and Reusable: Designed for adaptability, enabling consistent application for in-depth forecasting.
Key Features
- Customizable Forecast Inputs: Adjust essential metrics such as revenue growth, EBITDA %, and capital expenditures.
- Instant DCF Valuation: Quickly computes intrinsic value, NPV, and additional financial metrics.
- High Precision Valuation: Leverages Jiangsu Cai Qin Technology Co., Ltd's (688182SS) actual financial data for accurate valuation results.
- Streamlined Scenario Analysis: Effortlessly explore various assumptions and evaluate results side by side.
- Efficiency Booster: Avoid the hassle of creating intricate valuation models from the ground up.
How It Functions
- Step 1: Download the Excel spreadsheet.
- Step 2: Review the pre-filled data for Jiangsu Cai Qin Technology Co., Ltd (688182SS) (historical and forecasted).
- Step 3: Modify key assumptions (highlighted in yellow) based on your evaluation.
- Step 4: Observe automatic recalculations of Jiangsu Cai Qin Technology Co., Ltd (688182SS)'s intrinsic value.
- Step 5: Leverage the results for investment strategies or reporting purposes.
Why Select This Calculator for Jiangsu Cai Qin Technology Co., Ltd (688182SS)?
- Reliable Data: Access authentic financial metrics from Jiangsu Cai Qin Technology for trustworthy valuation results.
- Adjustable Parameters: Tailor essential inputs such as growth rates, WACC, and tax rates to align with your financial forecasts.
- Efficient: Pre-configured calculations save you from starting from the ground up.
- Professional Quality: Crafted for investors, analysts, and consultants looking for precision.
- User-Centric Design: Featuring an intuitive interface and clear, step-by-step guidance for all users.
Who Can Benefit from This Product?
- Investors: Evaluate the valuation of Jiangsu Cai Qin Technology Co., Ltd (688182SS) before making trading decisions.
- CFOs and Financial Analysts: Enhance valuation workflows and assess financial projections.
- Startup Founders: Gain insights into how established companies like Jiangsu Cai Qin Technology Co., Ltd (688182SS) are appraised.
- Consultants: Provide expert valuation reports for your clientele.
- Students and Educators: Utilize real market data to refine and teach valuation methodologies.
Contents of the Template
- Preloaded JIANGSU CAI QIN Data: Historical and projected financial information, including revenue, EBIT, and capital expenditures.
- DCF and WACC Models: Advanced spreadsheets for calculating intrinsic value and Weighted Average Cost of Capital.
- Customizable Inputs: Cells highlighted in yellow for modifying revenue growth, tax rates, and discount rates.
- Financial Statements: Detailed annual and quarterly financials for in-depth analysis.
- Key Ratios: Metrics for profitability, leverage, and efficiency to assess performance.
- Dashboard and Charts: Visual representations of valuation results and underlying assumptions.
Disclaimer
All information, articles, and product details provided on this website are for general informational and educational purposes only. We do not claim any ownership over, nor do we intend to infringe upon, any trademarks, copyrights, logos, brand names, or other intellectual property mentioned or depicted on this site. Such intellectual property remains the property of its respective owners, and any references here are made solely for identification or informational purposes, without implying any affiliation, endorsement, or partnership.
We make no representations or warranties, express or implied, regarding the accuracy, completeness, or suitability of any content or products presented. Nothing on this website should be construed as legal, tax, investment, financial, medical, or other professional advice. In addition, no part of this site—including articles or product references—constitutes a solicitation, recommendation, endorsement, advertisement, or offer to buy or sell any securities, franchises, or other financial instruments, particularly in jurisdictions where such activity would be unlawful.
All content is of a general nature and may not address the specific circumstances of any individual or entity. It is not a substitute for professional advice or services. Any actions you take based on the information provided here are strictly at your own risk. You accept full responsibility for any decisions or outcomes arising from your use of this website and agree to release us from any liability in connection with your use of, or reliance upon, the content or products found herein.