
|
Xinjiang Daqo New Energy Co., Ltd. (688303.SS) DCF -Bewertung |
Fully Editable: Tailor To Your Needs In Excel Or Sheets
Professional Design: Trusted, Industry-Standard Templates
Investor-Approved Valuation Models
MAC/PC Compatible, Fully Unlocked
No Expertise Is Needed; Easy To Follow
Xinjiang Daqo New Energy Co.,Ltd. (688303.SS) Bundle
Als Anleger oder Analyst ist dieser DCF-Taschenrechner für Xinjiang DAQO New Energy Co., Ltd. (688303S) Ihre Anlaufstelle für eine genaue Bewertung. Mit echten Daten des Unternehmens können Sie problemlos Prognosen anpassen und die Auswirkungen in Echtzeit beobachten.
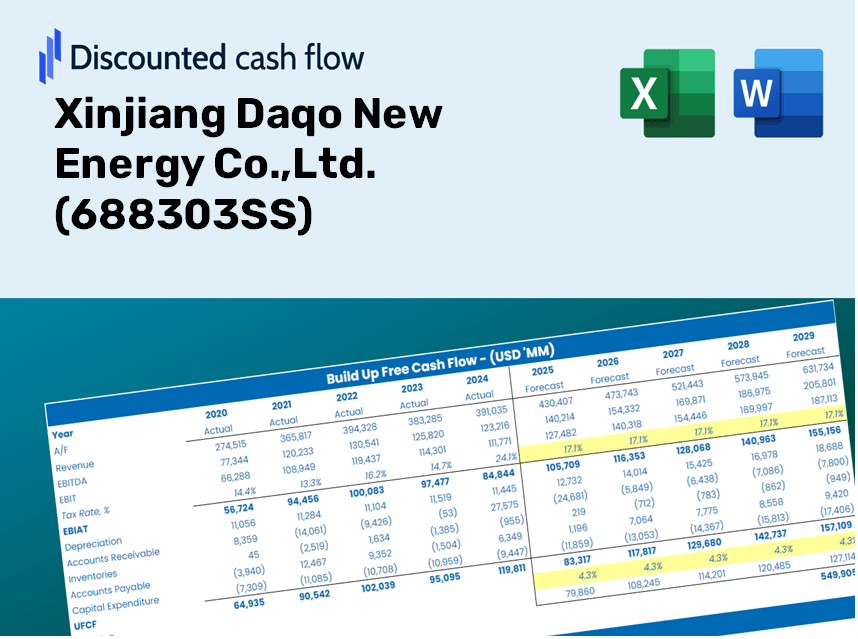
Discounted Cash Flow (DCF) - (USD MM)
| Year | AY1 2020 |
AY2 2021 |
AY3 2022 |
AY4 2023 |
AY5 2024 |
FY1 2025 |
FY2 2026 |
FY3 2027 |
FY4 2028 |
FY5 2029 |
|---|---|---|---|---|---|---|---|---|---|---|
| Revenue | 4,664.3 | 10,831.9 | 30,940.3 | 16,329.1 | 7,410.5 | 9,229.0 | 11,493.8 | 14,314.3 | 17,827.0 | 22,201.7 |
| Revenue Growth, % | 0 | 132.23 | 185.64 | -47.22 | -54.62 | 24.54 | 24.54 | 24.54 | 24.54 | 24.54 |
| EBITDA | 1,867.8 | 7,364.4 | 23,134.8 | 7,017.2 | -655.1 | 4,004.3 | 4,986.9 | 6,210.7 | 7,734.7 | 9,632.8 |
| EBITDA, % | 40.04 | 67.99 | 74.77 | 42.97 | -8.84 | 43.39 | 43.39 | 43.39 | 43.39 | 43.39 |
| Depreciation | 461.1 | 501.6 | 721.7 | 1,052.9 | 1,488.2 | 800.7 | 997.2 | 1,241.9 | 1,546.6 | 1,926.2 |
| Depreciation, % | 9.88 | 4.63 | 2.33 | 6.45 | 20.08 | 8.68 | 8.68 | 8.68 | 8.68 | 8.68 |
| EBIT | 1,406.7 | 6,862.8 | 22,413.0 | 5,964.3 | -2,143.2 | 3,203.6 | 3,989.7 | 4,968.8 | 6,188.1 | 7,706.7 |
| EBIT, % | 30.16 | 63.36 | 72.44 | 36.53 | -28.92 | 34.71 | 34.71 | 34.71 | 34.71 | 34.71 |
| Total Cash | 695.7 | 6,301.8 | 23,802.9 | 19,629.0 | 5,007.5 | 5,862.3 | 7,300.8 | 9,092.4 | 11,323.7 | 14,102.5 |
| Total Cash, percent | .0 | .0 | .0 | .0 | .0 | .0 | .0 | .0 | .0 | .0 |
| Account Receivables | 1,057.0 | 3,679.9 | 8,315.7 | 1,118.5 | 546.7 | 1,804.1 | 2,246.8 | 2,798.2 | 3,484.8 | 4,340.0 |
| Account Receivables, % | 22.66 | 33.97 | 26.88 | 6.85 | 7.38 | 19.55 | 19.55 | 19.55 | 19.55 | 19.55 |
| Inventories | 321.4 | 2,124.2 | 1,229.8 | 1,336.3 | 1,195.5 | 1,011.4 | 1,259.6 | 1,568.7 | 1,953.6 | 2,433.0 |
| Inventories, % | 6.89 | 19.61 | 3.97 | 8.18 | 16.13 | 10.96 | 10.96 | 10.96 | 10.96 | 10.96 |
| Accounts Payable | 681.6 | 1,451.1 | 985.3 | 661.3 | 241.9 | 710.8 | 885.2 | 1,102.4 | 1,373.0 | 1,709.9 |
| Accounts Payable, % | 14.61 | 13.4 | 3.18 | 4.05 | 3.26 | 7.7 | 7.7 | 7.7 | 7.7 | 7.7 |
| Capital Expenditure | -441.9 | -1,896.8 | -8,523.2 | -5,219.2 | -527.2 | -1,727.9 | -2,151.9 | -2,679.9 | -3,337.6 | -4,156.6 |
| Capital Expenditure, % | -9.47 | -17.51 | -27.55 | -31.96 | -7.11 | -18.72 | -18.72 | -18.72 | -18.72 | -18.72 |
| Tax Rate, % | 15.6 | 15.6 | 15.6 | 15.6 | 15.6 | 15.6 | 15.6 | 15.6 | 15.6 | 15.6 |
| EBITAT | 1,200.4 | 5,838.8 | 19,081.4 | 5,003.4 | -1,809.0 | 2,715.6 | 3,382.0 | 4,211.9 | 5,245.5 | 6,532.8 |
| Depreciation | ||||||||||
| Changes in Account Receivables | ||||||||||
| Changes in Inventories | ||||||||||
| Changes in Accounts Payable | ||||||||||
| Capital Expenditure | ||||||||||
| UFCF | 522.6 | 787.6 | 7,072.8 | 7,603.7 | -554.8 | 1,184.1 | 1,710.8 | 2,130.7 | 2,653.5 | 3,304.7 |
| WACC, % | 6.71 | 6.71 | 6.71 | 6.71 | 6.71 | 6.71 | 6.71 | 6.71 | 6.71 | 6.71 |
| PV UFCF | ||||||||||
| SUM PV UFCF | 8,800.0 | |||||||||
| Long Term Growth Rate, % | 0.50 | |||||||||
| Free cash flow (T + 1) | 3,321 | |||||||||
| Terminal Value | 53,468 | |||||||||
| Present Terminal Value | 38,640 | |||||||||
| Enterprise Value | 47,440 | |||||||||
| Net Debt | -5,007 | |||||||||
| Equity Value | 52,448 | |||||||||
| Diluted Shares Outstanding, MM | 2,140 | |||||||||
| Equity Value Per Share | 24.51 |
What You Will Receive
- Authentic Daqo Financial Data: Comprehensive historical and projected data for precise valuation.
- Customizable Parameters: Adjust WACC, tax rates, revenue growth, and capital expenditure inputs.
- Instantaneous Calculations: Intrinsic value and NPV are computed in real-time.
- Scenario Evaluation: Analyze various scenarios to assess the future performance of Xinjiang Daqo New Energy Co., Ltd. (688303SS).
- User-Friendly Interface: Designed for professionals while remaining approachable for newcomers.
Key Features
- Accurate Financial Data for Daqo New Energy: Gain access to reliable pre-loaded historical figures and future forecasts.
- Flexible Forecasting Inputs: Modify yellow-highlighted fields such as WACC, growth rates, and profit margins.
- Automated Calculations: Real-time updates for DCF, Net Present Value (NPV), and cash flow analyses.
- User-Friendly Dashboard: Intuitive charts and summaries for a clear view of your valuation outcomes.
- Designed for All Levels: A straightforward layout tailored for investors, CFOs, and consultants alike.
How It Works
- Step 1: Download the Excel file.
- Step 2: Examine the pre-filled financial data and forecasts for Xinjiang Daqo New Energy Co., Ltd. (688303SS).
- Step 3: Adjust key inputs such as revenue growth, WACC, and tax rates (highlighted cells).
- Step 4: Observe the DCF model refresh in real-time as you modify your assumptions.
- Step 5: Evaluate the results and apply them to your investment strategies.
Why Use This Calculator for Xinjiang Daqo New Energy Co., Ltd. (688303SS)?
- Precision: Utilizes authentic financial data from Xinjiang Daqo to ensure reliable calculations.
- Customizable: Built to allow users to easily adjust and test various inputs.
- Efficiency: Eliminate the need to create a DCF model from the ground up.
- CFO-Level Quality: Crafted with the expertise and attention to detail expected at the highest financial levels.
- User-Friendly: Designed for accessibility, catering to users without extensive financial modeling skills.
Who Can Benefit from This Product?
- Investors: Accurately assess the fair value of Xinjiang Daqo New Energy Co.,Ltd. (688303SS) prior to making investment choices.
- CFOs: Utilize a professional-grade DCF model for comprehensive financial reporting and analysis.
- Consultants: Efficiently customize the template for client valuation reports.
- Entrepreneurs: Understand the financial modeling practices employed by leading companies in the industry.
- Educators: Employ this tool as a resource for teaching valuation techniques.
Contents of the Template
- Preloaded Daqo Data: Historical and projected financial information, such as revenue, EBIT, and capital expenditures.
- DCF and WACC Models: Advanced templates for calculating intrinsic value and Weighted Average Cost of Capital.
- Editable Inputs: Yellow-highlighted fields for modifying revenue growth, tax rates, and discount rates.
- Financial Statements: Detailed annual and quarterly financial reports for in-depth analysis.
- Key Ratios: Metrics for profitability, leverage, and efficiency to assess performance.
- Dashboard and Charts: Visual representations of valuation results and underlying assumptions.
Disclaimer
All information, articles, and product details provided on this website are for general informational and educational purposes only. We do not claim any ownership over, nor do we intend to infringe upon, any trademarks, copyrights, logos, brand names, or other intellectual property mentioned or depicted on this site. Such intellectual property remains the property of its respective owners, and any references here are made solely for identification or informational purposes, without implying any affiliation, endorsement, or partnership.
We make no representations or warranties, express or implied, regarding the accuracy, completeness, or suitability of any content or products presented. Nothing on this website should be construed as legal, tax, investment, financial, medical, or other professional advice. In addition, no part of this site—including articles or product references—constitutes a solicitation, recommendation, endorsement, advertisement, or offer to buy or sell any securities, franchises, or other financial instruments, particularly in jurisdictions where such activity would be unlawful.
All content is of a general nature and may not address the specific circumstances of any individual or entity. It is not a substitute for professional advice or services. Any actions you take based on the information provided here are strictly at your own risk. You accept full responsibility for any decisions or outcomes arising from your use of this website and agree to release us from any liability in connection with your use of, or reliance upon, the content or products found herein.