
|
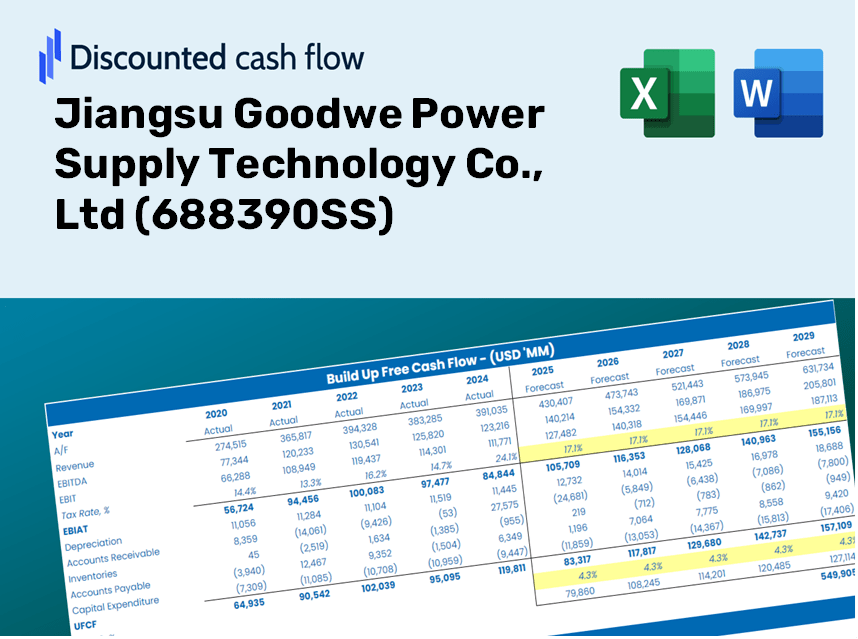
Jiangsu Goodwe Power Supply Technology Co., Ltd (688390.SS) DCF -Bewertung |
Fully Editable: Tailor To Your Needs In Excel Or Sheets
Professional Design: Trusted, Industry-Standard Templates
Investor-Approved Valuation Models
MAC/PC Compatible, Fully Unlocked
No Expertise Is Needed; Easy To Follow
Jiangsu Goodwe Power Supply Technology Co., Ltd (688390.SS) Bundle
Optimieren Sie Ihre Analyse und verbessern Sie die Präzision mit unserem DCF -Taschenrechner (688390S)! Die Verwendung von Echtzeitdaten von Jiangsu Goodwe Power Supply Technology Co., Ltd und anpassbare Annahmen ermöglicht es Ihnen, genau wie ein erfahrener Investor prognostiziert, analysieren und value (688390S).
Discounted Cash Flow (DCF) - (USD MM)
| Year | AY1 2020 |
AY2 2021 |
AY3 2022 |
AY4 2023 |
AY5 2024 |
FY1 2025 |
FY2 2026 |
FY3 2027 |
FY4 2028 |
FY5 2029 |
|---|---|---|---|---|---|---|---|---|---|---|
| Revenue | 1,589.1 | 2,678.1 | 4,710.2 | 7,352.7 | 6,737.9 | 6,757.3 | 6,776.8 | 6,796.4 | 6,816.0 | 6,835.7 |
| Revenue Growth, % | 0 | 68.53 | 75.88 | 56.1 | -8.36 | 0.28869 | 0.28869 | 0.28869 | 0.28869 | 0.28869 |
| EBITDA | 315.1 | 355.8 | 659.9 | 947.1 | -29.9 | 804.9 | 807.3 | 809.6 | 811.9 | 814.3 |
| EBITDA, % | 19.83 | 13.29 | 14.01 | 12.88 | -0.44367 | 11.91 | 11.91 | 11.91 | 11.91 | 11.91 |
| Depreciation | 19.7 | 42.5 | 74.0 | 97.3 | 137.3 | 104.9 | 105.2 | 105.5 | 105.8 | 106.1 |
| Depreciation, % | 1.24 | 1.59 | 1.57 | 1.32 | 2.04 | 1.55 | 1.55 | 1.55 | 1.55 | 1.55 |
| EBIT | 295.4 | 313.3 | 585.9 | 849.8 | -167.2 | 700.1 | 702.1 | 704.1 | 706.2 | 708.2 |
| EBIT, % | 18.59 | 11.7 | 12.44 | 11.56 | -2.48 | 10.36 | 10.36 | 10.36 | 10.36 | 10.36 |
| Total Cash | 1,360.4 | 1,301.7 | 1,656.8 | 1,838.7 | 1,088.3 | 2,845.5 | 2,853.7 | 2,861.9 | 2,870.2 | 2,878.5 |
| Total Cash, percent | .0 | .0 | .0 | .0 | .0 | .0 | .0 | .0 | .0 | .0 |
| Account Receivables | 427.5 | 671.9 | 833.6 | 922.8 | 1,445.3 | 1,401.3 | 1,405.3 | 1,409.4 | 1,413.5 | 1,417.5 |
| Account Receivables, % | 26.9 | 25.09 | 17.7 | 12.55 | 21.45 | 20.74 | 20.74 | 20.74 | 20.74 | 20.74 |
| Inventories | 349.6 | 855.0 | 1,578.7 | 1,943.8 | 2,637.8 | 2,068.1 | 2,074.0 | 2,080.0 | 2,086.0 | 2,092.0 |
| Inventories, % | 22 | 31.92 | 33.52 | 26.44 | 39.15 | 30.6 | 30.6 | 30.6 | 30.6 | 30.6 |
| Accounts Payable | 906.5 | 1,643.9 | 2,311.5 | 2,137.4 | 1,241.5 | 2,905.7 | 2,914.1 | 2,922.5 | 2,930.9 | 2,939.4 |
| Accounts Payable, % | 57.05 | 61.38 | 49.07 | 29.07 | 18.43 | 43 | 43 | 43 | 43 | 43 |
| Capital Expenditure | -128.6 | -318.7 | -486.0 | -565.3 | -495.3 | -612.9 | -614.7 | -616.4 | -618.2 | -620.0 |
| Capital Expenditure, % | -8.09 | -11.9 | -10.32 | -7.69 | -7.35 | -9.07 | -9.07 | -9.07 | -9.07 | -9.07 |
| Tax Rate, % | 7.41 | 7.41 | 7.41 | 7.41 | 7.41 | 7.41 | 7.41 | 7.41 | 7.41 | 7.41 |
| EBITAT | 254.2 | 295.7 | 551.2 | 721.4 | -154.8 | 632.9 | 634.7 | 636.5 | 638.4 | 640.2 |
| Depreciation | ||||||||||
| Changes in Account Receivables | ||||||||||
| Changes in Inventories | ||||||||||
| Changes in Accounts Payable | ||||||||||
| Capital Expenditure | ||||||||||
| UFCF | 274.7 | 7.1 | -78.5 | -375.1 | -2,625.2 | 2,402.7 | 123.6 | 123.9 | 124.3 | 124.6 |
| WACC, % | 6.37 | 6.42 | 6.41 | 6.36 | 6.41 | 6.39 | 6.39 | 6.39 | 6.39 | 6.39 |
| PV UFCF | ||||||||||
| SUM PV UFCF | 2,658.8 | |||||||||
| Long Term Growth Rate, % | 3.50 | |||||||||
| Free cash flow (T + 1) | 129 | |||||||||
| Terminal Value | 4,460 | |||||||||
| Present Terminal Value | 3,271 | |||||||||
| Enterprise Value | 5,930 | |||||||||
| Net Debt | 1,649 | |||||||||
| Equity Value | 4,282 | |||||||||
| Diluted Shares Outstanding, MM | 238 | |||||||||
| Equity Value Per Share | 18.01 |
What You Will Receive
- Genuine Goodwe Financial Data: Pre-loaded with Jiangsu Goodwe's historical and projected figures for accurate analysis.
- Fully Customizable Template: Easily adjust essential inputs like revenue growth, WACC, and EBITDA %.
- Instant Calculations: Witness immediate updates to Goodwe's intrinsic value as you modify inputs.
- Professional Valuation Tool: Crafted for investors, analysts, and consultants aiming for precise DCF outputs.
- User-Friendly Interface: Intuitive layout and straightforward guidance suitable for all skill levels.
Key Features
- Comprehensive DCF Calculator: Features both unlevered and levered DCF valuation models tailored for Jiangsu Goodwe Power Supply Technology Co., Ltd (688390SS).
- WACC Estimator: A ready-to-use Weighted Average Cost of Capital spreadsheet with adjustable parameters.
- Customizable Forecast Assumptions: Easily adjust growth rates, capital investments, and discount rates as needed.
- Integrated Financial Ratios: Evaluate profitability, leverage, and efficiency ratios specifically for Jiangsu Goodwe Power Supply Technology Co., Ltd (688390SS).
- Interactive Dashboard and Graphs: Visual representations to summarize essential valuation metrics for straightforward analysis.
How It Operates
- Step 1: Download the Excel template.
- Step 2: Examine the pre-filled Goodwe data (historical and forecasted).
- Step 3: Modify key assumptions (highlighted in yellow) based on your insights.
- Step 4: Observe the automatic recalculations for Goodwe's intrinsic value.
- Step 5: Utilize the results for your investment strategies or reporting needs.
Why Choose Goodwe's Financial Calculator?
- All-in-One Solution: Combines DCF, WACC, and a variety of financial ratio analyses into a single tool.
- Flexible Parameters: Modify the highlighted cells to explore different financial scenarios.
- In-Depth Analysis: Automatically computes Goodwe’s intrinsic value and Net Present Value.
- Built-In Data: Access to historical and projected data for precise analysis.
- Designed for Professionals: Perfect for financial analysts, investors, and business consultants looking to evaluate (688390SS).
Who Should Use This Product?
- Investors: Effectively assess the fair value of Jiangsu Goodwe Power Supply Technology Co., Ltd (688390SS) prior to making investment choices.
- CFOs: Utilize a high-quality DCF model for accurate financial reporting and analysis.
- Consultants: Seamlessly modify the template for client valuation reports.
- Entrepreneurs: Discover financial modeling strategies adopted by leading companies in the industry.
- Educators: Incorporate it as a teaching tool to illustrate various valuation methodologies.
What the Template Contains
- Pre-Filled DCF Model: Jiangsu Goodwe Power Supply Technology Co., Ltd’s financial data preloaded for immediate use.
- WACC Calculator: Comprehensive calculations for Weighted Average Cost of Capital.
- Financial Ratios: Assess Jiangsu Goodwe’s profitability, leverage, and operational efficiency.
- Editable Inputs: Modify assumptions like growth rates, margins, and CAPEX to suit your specific scenarios.
- Financial Statements: Annual and quarterly reports to facilitate in-depth analysis.
- Interactive Dashboard: Effortlessly visualize essential valuation metrics and results.
Disclaimer
All information, articles, and product details provided on this website are for general informational and educational purposes only. We do not claim any ownership over, nor do we intend to infringe upon, any trademarks, copyrights, logos, brand names, or other intellectual property mentioned or depicted on this site. Such intellectual property remains the property of its respective owners, and any references here are made solely for identification or informational purposes, without implying any affiliation, endorsement, or partnership.
We make no representations or warranties, express or implied, regarding the accuracy, completeness, or suitability of any content or products presented. Nothing on this website should be construed as legal, tax, investment, financial, medical, or other professional advice. In addition, no part of this site—including articles or product references—constitutes a solicitation, recommendation, endorsement, advertisement, or offer to buy or sell any securities, franchises, or other financial instruments, particularly in jurisdictions where such activity would be unlawful.
All content is of a general nature and may not address the specific circumstances of any individual or entity. It is not a substitute for professional advice or services. Any actions you take based on the information provided here are strictly at your own risk. You accept full responsibility for any decisions or outcomes arising from your use of this website and agree to release us from any liability in connection with your use of, or reliance upon, the content or products found herein.