
|
3Peak Incorporated (688536.SS) DCF -Bewertung |
Fully Editable: Tailor To Your Needs In Excel Or Sheets
Professional Design: Trusted, Industry-Standard Templates
Investor-Approved Valuation Models
MAC/PC Compatible, Fully Unlocked
No Expertise Is Needed; Easy To Follow
3Peak Incorporated (688536.SS) Bundle
Verbessern Sie Ihre Anlagestrategien mit dem DCF -Taschenrechner des 3Peak Incorporated (688536S)! Erforschen Sie echte Finanzdaten, passen Sie Wachstumsprojektionen und -kosten an und beobachten Sie sofort, wie sich diese Modifikationen auf den inneren Wert von 3Peak Incorporated auswirken.
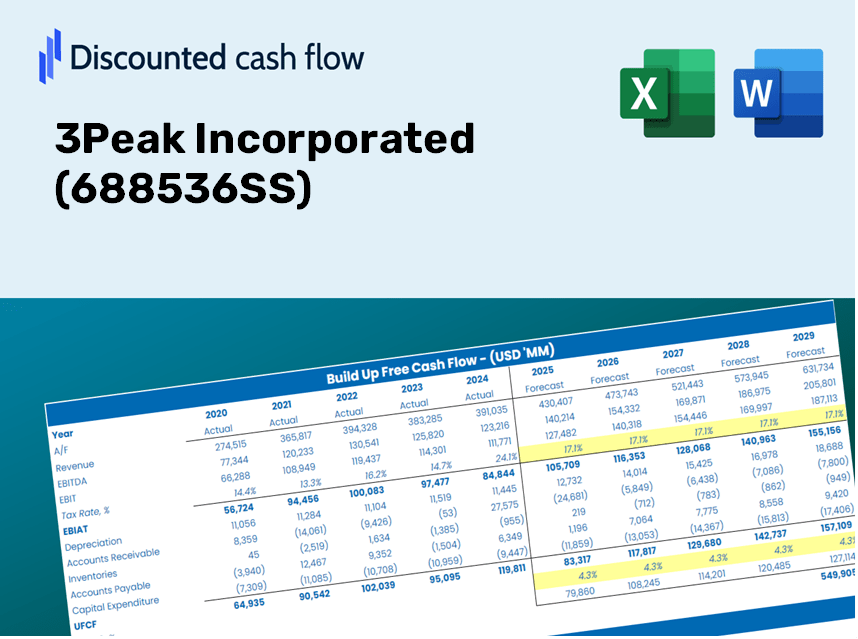
Discounted Cash Flow (DCF) - (USD MM)
| Year | AY1 2020 |
AY2 2021 |
AY3 2022 |
AY4 2023 |
AY5 2024 |
FY1 2025 |
FY2 2026 |
FY3 2027 |
FY4 2028 |
FY5 2029 |
|---|---|---|---|---|---|---|---|---|---|---|
| Revenue | 566.5 | 1,325.9 | 1,783.4 | 1,093.5 | 1,219.5 | 1,527.4 | 1,913.1 | 2,396.1 | 3,001.1 | 3,758.8 |
| Revenue Growth, % | 0 | 134.06 | 34.5 | -38.68 | 11.52 | 25.25 | 25.25 | 25.25 | 25.25 | 25.25 |
| EBITDA | 171.6 | 384.9 | 198.0 | -132.0 | -248.8 | 115.9 | 145.2 | 181.8 | 227.7 | 285.2 |
| EBITDA, % | 30.29 | 29.03 | 11.1 | -12.07 | -20.4 | 7.59 | 7.59 | 7.59 | 7.59 | 7.59 |
| Depreciation | 8.0 | 17.6 | 30.6 | 59.5 | 52.1 | 43.3 | 54.2 | 67.9 | 85.0 | 106.5 |
| Depreciation, % | 1.41 | 1.33 | 1.72 | 5.44 | 4.27 | 2.83 | 2.83 | 2.83 | 2.83 | 2.83 |
| EBIT | 163.6 | 367.3 | 167.4 | -191.5 | -301.0 | 72.6 | 91.0 | 113.9 | 142.7 | 178.7 |
| EBIT, % | 28.88 | 27.7 | 9.39 | -17.51 | -24.68 | 4.76 | 4.76 | 4.76 | 4.76 | 4.76 |
| Total Cash | 2,458.6 | 2,663.7 | 2,935.6 | 4,369.7 | 3,426.8 | 1,527.4 | 1,913.1 | 2,396.1 | 3,001.1 | 3,758.8 |
| Total Cash, percent | .0 | .0 | .0 | .0 | .0 | .0 | .0 | .0 | .0 | .0 |
| Account Receivables | 75.8 | 264.3 | 188.7 | 216.3 | 266.1 | 261.2 | 327.1 | 409.7 | 513.2 | 642.7 |
| Account Receivables, % | 13.38 | 19.94 | 10.58 | 19.78 | 21.82 | 17.1 | 17.1 | 17.1 | 17.1 | 17.1 |
| Inventories | 71.1 | 146.4 | 291.0 | 428.2 | 385.5 | 338.1 | 423.5 | 530.4 | 664.3 | 832.0 |
| Inventories, % | 12.55 | 11.04 | 16.32 | 39.15 | 31.61 | 22.13 | 22.13 | 22.13 | 22.13 | 22.13 |
| Accounts Payable | 28.4 | 94.5 | 95.3 | 101.1 | 147.1 | 118.5 | 148.4 | 185.9 | 232.8 | 291.6 |
| Accounts Payable, % | 5.02 | 7.13 | 5.34 | 9.24 | 12.07 | 7.76 | 7.76 | 7.76 | 7.76 | 7.76 |
| Capital Expenditure | -24.8 | -53.0 | -184.4 | -234.3 | -212.9 | -175.9 | -220.3 | -276.0 | -345.7 | -432.9 |
| Capital Expenditure, % | -4.37 | -4 | -10.34 | -21.43 | -17.46 | -11.52 | -11.52 | -11.52 | -11.52 | -11.52 |
| Tax Rate, % | -0.07664493 | -0.07664493 | -0.07664493 | -0.07664493 | -0.07664493 | -0.07664493 | -0.07664493 | -0.07664493 | -0.07664493 | -0.07664493 |
| EBITAT | 166.1 | 366.0 | 167.3 | -80.7 | -301.2 | 64.2 | 80.4 | 100.7 | 126.1 | 157.9 |
| Depreciation | ||||||||||
| Changes in Account Receivables | ||||||||||
| Changes in Inventories | ||||||||||
| Changes in Accounts Payable | ||||||||||
| Capital Expenditure | ||||||||||
| UFCF | 30.8 | 132.8 | -54.6 | -414.5 | -423.1 | -44.7 | -207.2 | -259.5 | -325.0 | -407.0 |
| WACC, % | 9.31 | 9.31 | 9.31 | 9.27 | 9.31 | 9.3 | 9.3 | 9.3 | 9.3 | 9.3 |
| PV UFCF | ||||||||||
| SUM PV UFCF | -901.5 | |||||||||
| Long Term Growth Rate, % | 4.00 | |||||||||
| Free cash flow (T + 1) | -423 | |||||||||
| Terminal Value | -7,981 | |||||||||
| Present Terminal Value | -5,115 | |||||||||
| Enterprise Value | -6,017 | |||||||||
| Net Debt | -923 | |||||||||
| Equity Value | -5,094 | |||||||||
| Diluted Shares Outstanding, MM | 131 | |||||||||
| Equity Value Per Share | -38.74 |
What You Will Receive
- Customizable Excel Template: A fully adaptable Excel-based DCF Calculator featuring pre-filled real 3Peak Incorporated (688536SS) financial data.
- Accurate Data: Historical information and future projections (highlighted in the yellow cells).
- Flexible Forecasting: Modify forecast variables such as revenue growth, EBITDA %, and WACC.
- Instant Calculations: Quickly observe how your inputs affect the valuation of 3Peak Incorporated (688536SS).
- Professional-Grade Tool: Designed for investors, CFOs, consultants, and financial analysts.
- Intuitive Interface: Organized for clarity and usability, complete with step-by-step guidance.
Core Features
- Customizable Forecast Settings: Adjust essential parameters such as revenue growth, EBITDA %, and capital investments.
- Instant DCF Valuation: Quickly determines intrinsic value, NPV, and additional financial metrics.
- High-Precision Accuracy: Leverages 3Peak Incorporated's real-world financial data for dependable valuation results.
- Simplified Scenario Analysis: Effortlessly evaluate various assumptions and juxtapose results.
- Efficiency Booster: Remove the hassle of constructing intricate valuation models from the ground up.
How It Functions
- Step 1: Download the Excel document.
- Step 2: Explore 3Peak Incorporated’s pre-filled financial data and projections.
- Step 3: Adjust key inputs such as revenue growth, WACC, and tax rates (highlighted cells).
- Step 4: Observe the DCF model refresh in real-time as you modify your assumptions.
- Step 5: Evaluate the results and leverage them for your investment strategies.
Why Opt for 3Peak Incorporated's Calculator?
- Reliable Data: Authentic financial metrics from 3Peak Incorporated ensure trustworthy valuation outcomes.
- Flexible Options: Modify essential variables such as growth rates, WACC, and tax rates to fit your forecasts.
- Efficiency Boost: Pre-configured calculations save time and eliminate the need for starting from zero.
- High-Quality Tool: Crafted for investors, analysts, and consultants seeking precision.
- User-Friendly Interface: An intuitive design with clear, step-by-step guidance makes it accessible for everyone.
Who Can Benefit from 3Peak Incorporated (688536SS)?
- Finance Students: Master valuation methods and apply them with actual market data.
- Academics: Utilize professional models in your teaching or research initiatives.
- Investors: Evaluate your own hypotheses and investigate valuation results for 3Peak Incorporated (688536SS).
- Analysts: Enhance your efficiency with a customizable, ready-to-use DCF model.
- Small Business Owners: Discover how large public entities like 3Peak Incorporated (688536SS) are assessed in the market.
Contents of the Template
- Comprehensive DCF Model: Editable template featuring in-depth valuation calculations.
- Real-World Data: Historical and projected financials for 3Peak Incorporated (688536SS) preloaded for your analysis.
- Customizable Parameters: Modify WACC, growth rates, and tax assumptions to explore various scenarios.
- Financial Statements: Complete annual and quarterly breakdowns for enhanced insights.
- Key Ratios: Integrated analysis covering profitability, efficiency, and leverage metrics.
- Dashboard with Visual Outputs: Visual representations like charts and tables for clear and actionable conclusions.
Disclaimer
All information, articles, and product details provided on this website are for general informational and educational purposes only. We do not claim any ownership over, nor do we intend to infringe upon, any trademarks, copyrights, logos, brand names, or other intellectual property mentioned or depicted on this site. Such intellectual property remains the property of its respective owners, and any references here are made solely for identification or informational purposes, without implying any affiliation, endorsement, or partnership.
We make no representations or warranties, express or implied, regarding the accuracy, completeness, or suitability of any content or products presented. Nothing on this website should be construed as legal, tax, investment, financial, medical, or other professional advice. In addition, no part of this site—including articles or product references—constitutes a solicitation, recommendation, endorsement, advertisement, or offer to buy or sell any securities, franchises, or other financial instruments, particularly in jurisdictions where such activity would be unlawful.
All content is of a general nature and may not address the specific circumstances of any individual or entity. It is not a substitute for professional advice or services. Any actions you take based on the information provided here are strictly at your own risk. You accept full responsibility for any decisions or outcomes arising from your use of this website and agree to release us from any liability in connection with your use of, or reliance upon, the content or products found herein.