
|
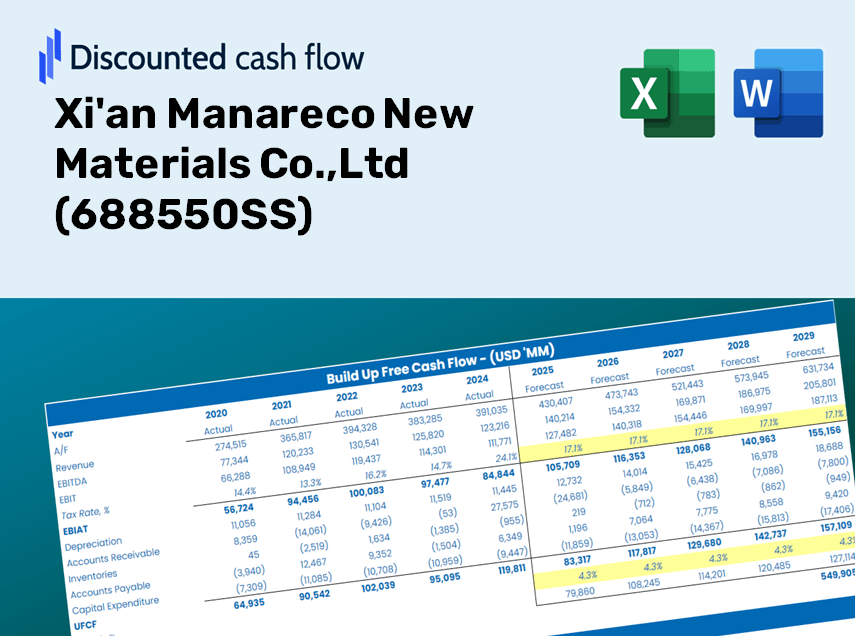
Xi'an Manareco New Materials Co., Ltd (688550.SS) DCF -Bewertung |
Fully Editable: Tailor To Your Needs In Excel Or Sheets
Professional Design: Trusted, Industry-Standard Templates
Investor-Approved Valuation Models
MAC/PC Compatible, Fully Unlocked
No Expertise Is Needed; Easy To Follow
Xi'an Manareco New Materials Co.,Ltd (688550.SS) Bundle
Unser (688550S) DCF -Taschenrechner entwickelt für die Genauigkeit und ermöglicht es Ihnen, Xi'an Manareco New Materials Co., Ltds Bewertung mit umfassenden Finanzdaten zu bewerten, und bietet vollständige Flexibilität, um alle wesentlichen Parameter für verbesserte Projektionen zu ändern.
Discounted Cash Flow (DCF) - (USD MM)
| Year | AY1 2020 |
AY2 2021 |
AY3 2022 |
AY4 2023 |
AY5 2024 |
FY1 2025 |
FY2 2026 |
FY3 2027 |
FY4 2028 |
FY5 2029 |
|---|---|---|---|---|---|---|---|---|---|---|
| Revenue | 1,049.6 | 1,525.6 | 1,480.4 | 1,208.2 | 1,458.7 | 1,621.8 | 1,803.2 | 2,004.9 | 2,229.1 | 2,478.3 |
| Revenue Growth, % | 0 | 45.35 | -2.96 | -18.39 | 20.74 | 11.18 | 11.18 | 11.18 | 11.18 | 11.18 |
| EBITDA | 277.2 | 291.9 | 337.4 | 250.4 | 409.8 | 380.0 | 422.5 | 469.8 | 522.3 | 580.7 |
| EBITDA, % | 26.41 | 19.13 | 22.79 | 20.73 | 28.09 | 23.43 | 23.43 | 23.43 | 23.43 | 23.43 |
| Depreciation | 74.1 | 80.6 | 104.0 | 145.0 | 158.1 | 136.9 | 152.2 | 169.3 | 188.2 | 209.2 |
| Depreciation, % | 7.06 | 5.28 | 7.03 | 12.01 | 10.84 | 8.44 | 8.44 | 8.44 | 8.44 | 8.44 |
| EBIT | 203.2 | 211.3 | 233.4 | 105.4 | 251.6 | 243.1 | 270.3 | 300.5 | 334.1 | 371.5 |
| EBIT, % | 19.36 | 13.85 | 15.77 | 8.72 | 17.25 | 14.99 | 14.99 | 14.99 | 14.99 | 14.99 |
| Total Cash | 1,723.6 | 1,776.6 | 978.0 | 1,025.7 | 1,005.6 | 1,362.0 | 1,514.3 | 1,683.7 | 1,871.9 | 2,081.3 |
| Total Cash, percent | .0 | .0 | .0 | .0 | .0 | .0 | .0 | .0 | .0 | .0 |
| Account Receivables | 235.6 | 472.9 | 255.6 | 250.7 | 274.3 | 357.7 | 397.6 | 442.1 | 491.6 | 546.5 |
| Account Receivables, % | 22.45 | 31 | 17.27 | 20.75 | 18.8 | 22.05 | 22.05 | 22.05 | 22.05 | 22.05 |
| Inventories | 301.9 | 527.8 | 624.7 | 500.0 | 485.1 | 584.5 | 649.9 | 722.6 | 803.4 | 893.2 |
| Inventories, % | 28.77 | 34.59 | 42.2 | 41.38 | 33.26 | 36.04 | 36.04 | 36.04 | 36.04 | 36.04 |
| Accounts Payable | 166.1 | 406.9 | 258.5 | 248.6 | 121.5 | 288.2 | 320.5 | 356.3 | 396.2 | 440.5 |
| Accounts Payable, % | 15.83 | 26.67 | 17.46 | 20.58 | 8.33 | 17.77 | 17.77 | 17.77 | 17.77 | 17.77 |
| Capital Expenditure | -140.1 | -405.8 | -517.5 | -268.0 | -163.0 | -351.2 | -390.4 | -434.1 | -482.6 | -536.6 |
| Capital Expenditure, % | -13.34 | -26.6 | -34.96 | -22.18 | -11.17 | -21.65 | -21.65 | -21.65 | -21.65 | -21.65 |
| Tax Rate, % | 13.43 | 13.43 | 13.43 | 13.43 | 13.43 | 13.43 | 13.43 | 13.43 | 13.43 | 13.43 |
| EBITAT | 174.6 | 186.7 | 211.5 | 95.7 | 217.8 | 215.0 | 239.1 | 265.8 | 295.5 | 328.6 |
| Depreciation | ||||||||||
| Changes in Account Receivables | ||||||||||
| Changes in Inventories | ||||||||||
| Changes in Accounts Payable | ||||||||||
| Capital Expenditure | ||||||||||
| UFCF | -262.8 | -360.8 | -230.1 | 92.5 | 77.1 | -15.2 | -72.3 | -80.3 | -89.3 | -99.3 |
| WACC, % | 6.45 | 6.45 | 6.45 | 6.45 | 6.45 | 6.45 | 6.45 | 6.45 | 6.45 | 6.45 |
| PV UFCF | ||||||||||
| SUM PV UFCF | -286.9 | |||||||||
| Long Term Growth Rate, % | 2.00 | |||||||||
| Free cash flow (T + 1) | -101 | |||||||||
| Terminal Value | -2,276 | |||||||||
| Present Terminal Value | -1,665 | |||||||||
| Enterprise Value | -1,952 | |||||||||
| Net Debt | -656 | |||||||||
| Equity Value | -1,296 | |||||||||
| Diluted Shares Outstanding, MM | 174 | |||||||||
| Equity Value Per Share | -7.47 |
Benefits You Will Receive
- Pre-Loaded Financial Model: Utilize Xi'an Manareco's actual data for accurate DCF valuation.
- Comprehensive Forecast Control: Modify revenue growth, profit margins, WACC, and other essential variables.
- Real-Time Calculations: Automatic updates allow you to view results instantly as adjustments are made.
- Professional-Grade Template: A polished Excel file crafted for high-quality valuation purposes.
- Flexible and Reusable: Designed for adaptability, enabling repeated use for in-depth forecasts.
Key Features
- 🔍 Real-Life (688550SS) Financials: Pre-filled historical and projected data for Xi'an Manareco New Materials Co., Ltd.
- ✏️ Fully Customizable Inputs: Adjust all essential parameters (yellow cells) such as WACC, growth %, and tax rates.
- 📊 Professional DCF Valuation: Built-in formulas to accurately calculate Xi'an Manareco's intrinsic value using the Discounted Cash Flow method.
- ⚡ Instant Results: Visualize Xi'an Manareco's valuation immediately after making adjustments.
- Scenario Analysis: Evaluate and compare outcomes for different financial assumptions side-by-side.
How It Functions
- Download: Obtain the pre-prepared Excel file featuring Xi'an Manareco New Materials Co., Ltd's financial data (688550SS).
- Customize: Modify forecasts such as revenue growth, EBITDA %, and WACC to fit your analysis.
- Real-Time Updates: The intrinsic value and NPV calculations refresh automatically as you input new data.
- Scenario Testing: Generate various projections and evaluate results side by side with ease.
- Informed Decisions: Utilize the valuation findings to shape your investment approach.
Why Select This Calculator for Xi'an Manareco New Materials Co., Ltd (688550SS)?
- Reliable Data: Utilize accurate financial statistics for Xi'an Manareco to ensure dependable valuation outcomes.
- Flexible Options: Tailor vital parameters such as growth rates, WACC, and tax rates to align with your forecasts.
- Efficient: Built-in calculations save you the hassle of creating a new model from the ground up.
- Expert-Level Tool: Crafted for investors, analysts, and consultants seeking in-depth insights.
- Easy to Use: User-friendly design and guided instructions ensure accessibility for everyone.
Who Should Utilize This Product?
- Individual Investors: Gain insights to make well-informed decisions regarding investments in Xi'an Manareco New Materials Co., Ltd. (688550SS).
- Financial Analysts: Enhance valuation workflows with comprehensive financial models tailored for Xi'an Manareco New Materials Co., Ltd. (688550SS).
- Consultants: Provide clients with accurate and timely valuation insights focused on Xi'an Manareco New Materials Co., Ltd. (688550SS).
- Business Owners: Learn about the valuation strategies of leading firms like Xi'an Manareco New Materials Co., Ltd. (688550SS) to inform your own business approach.
- Finance Students: Explore valuation methods using real-time data and examples from Xi'an Manareco New Materials Co., Ltd. (688550SS).
Overview of Template Components
- Historical Data: Provides past financial information and baseline forecasts for Xi'an Manareco New Materials Co.,Ltd (688550SS).
- DCF and Levered DCF Models: Comprehensive templates designed to assess the intrinsic value of Xi'an Manareco New Materials Co.,Ltd (688550SS).
- WACC Sheet: Ready-to-use calculations for the Weighted Average Cost of Capital.
- Editable Inputs: Customize key parameters such as growth rates, EBITDA percentages, and CAPEX assumptions.
- Quarterly and Annual Statements: Detailed breakdown of financial statements for Xi'an Manareco New Materials Co.,Ltd (688550SS).
- Interactive Dashboard: Dynamic visualization of valuation results and projections.
Disclaimer
All information, articles, and product details provided on this website are for general informational and educational purposes only. We do not claim any ownership over, nor do we intend to infringe upon, any trademarks, copyrights, logos, brand names, or other intellectual property mentioned or depicted on this site. Such intellectual property remains the property of its respective owners, and any references here are made solely for identification or informational purposes, without implying any affiliation, endorsement, or partnership.
We make no representations or warranties, express or implied, regarding the accuracy, completeness, or suitability of any content or products presented. Nothing on this website should be construed as legal, tax, investment, financial, medical, or other professional advice. In addition, no part of this site—including articles or product references—constitutes a solicitation, recommendation, endorsement, advertisement, or offer to buy or sell any securities, franchises, or other financial instruments, particularly in jurisdictions where such activity would be unlawful.
All content is of a general nature and may not address the specific circumstances of any individual or entity. It is not a substitute for professional advice or services. Any actions you take based on the information provided here are strictly at your own risk. You accept full responsibility for any decisions or outcomes arising from your use of this website and agree to release us from any liability in connection with your use of, or reliance upon, the content or products found herein.