
|
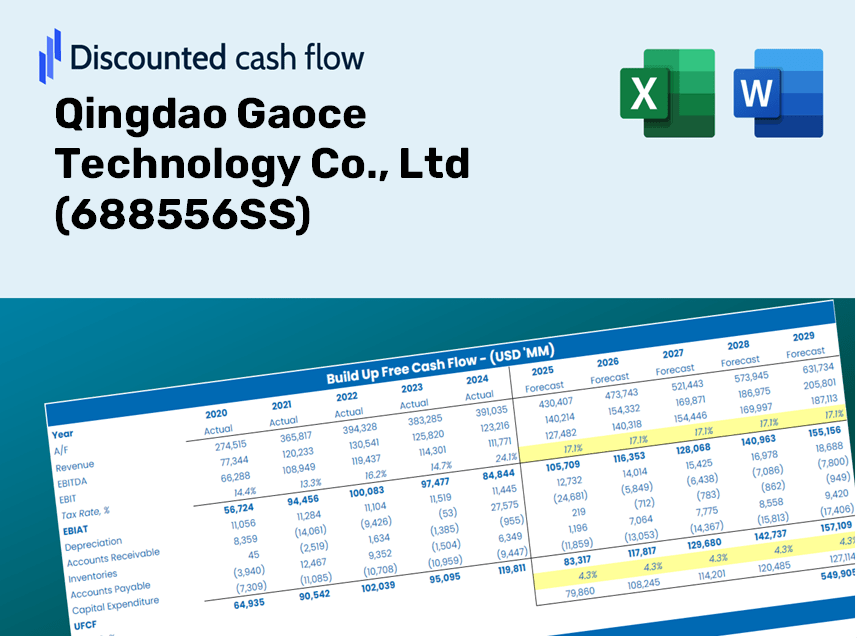
Qingdao Gaoce Technology Co., Ltd (688556.SS) DCF -Bewertung |
Fully Editable: Tailor To Your Needs In Excel Or Sheets
Professional Design: Trusted, Industry-Standard Templates
Investor-Approved Valuation Models
MAC/PC Compatible, Fully Unlocked
No Expertise Is Needed; Easy To Follow
Qingdao Gaoce Technology Co., Ltd (688556.SS) Bundle
Verbessern Sie Ihre Anlagestrategien mit dem DCF -Taschenrechner (688556S)! Verwenden Sie echte Finanzdaten von Qingdao Gaoce Technology Co., Ltd, passen Sie Wachstumsprojektionen und -kosten an und beobachten Sie sofort, wie sich diese Veränderungen auf den inneren Wert von [Unternehmen] auswirken.
Discounted Cash Flow (DCF) - (USD MM)
| Year | AY1 2020 |
AY2 2021 |
AY3 2022 |
AY4 2023 |
AY5 2024 |
FY1 2025 |
FY2 2026 |
FY3 2027 |
FY4 2028 |
FY5 2029 |
|---|---|---|---|---|---|---|---|---|---|---|
| Revenue | 746.1 | 1,566.6 | 3,570.6 | 6,183.9 | 4,474.2 | 7,220.8 | 11,653.4 | 18,806.9 | 30,351.7 | 48,983.4 |
| Revenue Growth, % | 0 | 109.97 | 127.92 | 73.19 | -27.65 | 61.39 | 61.39 | 61.39 | 61.39 | 61.39 |
| EBITDA | 70.5 | 236.7 | 968.6 | 1,858.4 | 221.3 | 1,251.9 | 2,020.4 | 3,260.6 | 5,262.1 | 8,492.3 |
| EBITDA, % | 9.45 | 15.11 | 27.13 | 30.05 | 4.95 | 17.34 | 17.34 | 17.34 | 17.34 | 17.34 |
| Depreciation | 24.5 | 41.5 | 104.8 | 182.6 | 275.3 | 259.6 | 418.9 | 676.0 | 1,091.0 | 1,760.8 |
| Depreciation, % | 3.29 | 2.65 | 2.93 | 2.95 | 6.15 | 3.59 | 3.59 | 3.59 | 3.59 | 3.59 |
| EBIT | 46.0 | 195.2 | 863.8 | 1,675.9 | -54.0 | 992.3 | 1,601.5 | 2,584.5 | 4,171.1 | 6,731.5 |
| EBIT, % | 6.16 | 12.46 | 24.19 | 27.1 | -1.21 | 13.74 | 13.74 | 13.74 | 13.74 | 13.74 |
| Total Cash | 418.1 | 527.7 | 954.9 | 2,363.9 | 585.4 | 2,422.9 | 3,910.2 | 6,310.5 | 10,184.3 | 16,436.1 |
| Total Cash, percent | .0 | .0 | .0 | .0 | .0 | .0 | .0 | .0 | .0 | .0 |
| Account Receivables | 665.2 | 1,228.6 | 2,251.0 | 3,633.3 | 3,212.3 | 5,215.8 | 8,417.6 | 13,584.9 | 21,924.1 | 35,382.5 |
| Account Receivables, % | 89.15 | 78.42 | 63.04 | 58.76 | 71.8 | 72.23 | 72.23 | 72.23 | 72.23 | 72.23 |
| Inventories | 338.7 | 557.6 | 1,049.7 | 1,566.1 | 662.4 | 2,173.6 | 3,507.9 | 5,661.3 | 9,136.5 | 14,745.1 |
| Inventories, % | 45.39 | 35.59 | 29.4 | 25.33 | 14.8 | 30.1 | 30.1 | 30.1 | 30.1 | 30.1 |
| Accounts Payable | 566.8 | 1,317.3 | 1,616.3 | 2,998.3 | 1,413.9 | 4,121.8 | 6,652.1 | 10,735.5 | 17,325.6 | 27,961.1 |
| Accounts Payable, % | 75.97 | 84.09 | 45.27 | 48.49 | 31.6 | 57.08 | 57.08 | 57.08 | 57.08 | 57.08 |
| Capital Expenditure | -98.3 | -83.2 | -203.3 | -297.0 | -284.8 | -510.4 | -823.8 | -1,329.5 | -2,145.6 | -3,462.7 |
| Capital Expenditure, % | -13.17 | -5.31 | -5.69 | -4.8 | -6.36 | -7.07 | -7.07 | -7.07 | -7.07 | -7.07 |
| Tax Rate, % | 52.09 | 52.09 | 52.09 | 52.09 | 52.09 | 52.09 | 52.09 | 52.09 | 52.09 | 52.09 |
| EBITAT | 48.4 | 180.2 | 770.4 | 1,485.0 | -25.9 | 829.6 | 1,338.8 | 2,160.7 | 3,487.1 | 5,627.7 |
| Depreciation | ||||||||||
| Changes in Account Receivables | ||||||||||
| Changes in Inventories | ||||||||||
| Changes in Accounts Payable | ||||||||||
| Capital Expenditure | ||||||||||
| UFCF | -462.4 | 106.7 | -543.7 | 853.7 | -295.0 | -228.1 | -1,071.9 | -1,729.9 | -2,791.8 | -4,505.6 |
| WACC, % | 4.99 | 4.93 | 4.9 | 4.89 | 4.53 | 4.85 | 4.85 | 4.85 | 4.85 | 4.85 |
| PV UFCF | ||||||||||
| SUM PV UFCF | -8,559.2 | |||||||||
| Long Term Growth Rate, % | 3.50 | |||||||||
| Free cash flow (T + 1) | -4,663 | |||||||||
| Terminal Value | -345,632 | |||||||||
| Present Terminal Value | -272,764 | |||||||||
| Enterprise Value | -281,324 | |||||||||
| Net Debt | 1,244 | |||||||||
| Equity Value | -282,567 | |||||||||
| Diluted Shares Outstanding, MM | 537 | |||||||||
| Equity Value Per Share | -526.36 |
What You'll Receive
- Customizable Excel Template: A tailor-made Excel DCF Calculator featuring pre-filled financial data for Qingdao Gaoce Technology Co., Ltd (688556SS).
- Real Data Insights: Access to historical data and future projections (highlighted in yellow cells).
- Flexible Forecasting: Adjust forecast parameters such as revenue growth, EBITDA margin, and WACC.
- Instant Calculations: Quickly observe how your adjustments affect the valuation of Qingdao Gaoce Technology Co., Ltd (688556SS).
- Professional Resource: Designed for investors, CFOs, consultants, and financial analysts.
- User-Friendly Layout: Organized for simplicity and efficiency, complete with step-by-step guidance.
Highlighted Features
- Customizable Forecast Assumptions: Adjust key variables such as revenue growth, EBITDA percentage, and capital expenditures.
- Instant DCF Valuation: Computes intrinsic value, NPV, and other financial metrics on the spot.
- High-Precision Results: Leverages Qingdao Gaoce Technology Co., Ltd's real financial data for more accurate valuation results.
- Simplified Scenario Analysis: Effortlessly explore various assumptions and analyze different outcomes.
- Efficiency Booster: Avoid the hassle of constructing intricate valuation models from the ground up.
How It Works
- Step 1: Download the Excel template for Qingdao Gaoce Technology Co., Ltd (688556SS).
- Step 2: Examine the pre-populated financial figures and forecasts specific to Qingdao Gaoce Technology.
- Step 3: Adjust key variables such as revenue growth, WACC, and tax rates (highlighted cells).
- Step 4: Observe the DCF model automatically refresh as you modify your assumptions.
- Step 5: Review the outputs to inform your investment strategy.
Why Select This Calculator?
- User-Friendly Interface: Built for both novices and seasoned users.
- Customizable Inputs: Effortlessly adjust assumptions to suit your analysis.
- Real-Time Feedback: Observe immediate updates to Qingdao Gaoce Technology’s valuation as you make changes.
- Preloaded Data: Comes ready with Qingdao Gaoce Technology’s actual financial information for swift evaluation.
- Relied Upon by Experts: Favored by investors and analysts for sound decision-making.
Who Can Benefit from This Product?
- Finance Students: Master valuation methods and practice them using actual market data.
- Academics: Integrate advanced financial models into your studies or research projects.
- Investors: Evaluate your investment hypotheses and analyze valuation results for Qingdao Gaoce Technology Co., Ltd (688556SS).
- Analysts: Enhance your analysis process with a tailored, ready-to-use DCF model.
- Small Business Owners: Discover how major public companies, like Qingdao Gaoce Technology Co., Ltd (688556SS), are evaluated in the market.
Contents of the Template
- Operating and Balance Sheet Data: Pre-filled historical data and forecasts for Qingdao Gaoce Technology Co., Ltd (688556SS), including revenue, EBITDA, EBIT, and capital expenditures.
- WACC Calculation: A dedicated worksheet for calculating the Weighted Average Cost of Capital (WACC), featuring parameters such as Beta, risk-free rate, and share price.
- DCF Valuation (Unlevered and Levered): Customizable Discounted Cash Flow models outlining intrinsic value with comprehensive calculations.
- Financial Statements: Pre-loaded financial statements (annual and quarterly) to facilitate in-depth analysis.
- Key Ratios: Includes various profitability, leverage, and efficiency ratios relevant to Qingdao Gaoce Technology Co., Ltd (688556SS).
- Dashboard and Charts: A visual summary of valuation outputs and underlying assumptions to streamline results analysis.
Disclaimer
All information, articles, and product details provided on this website are for general informational and educational purposes only. We do not claim any ownership over, nor do we intend to infringe upon, any trademarks, copyrights, logos, brand names, or other intellectual property mentioned or depicted on this site. Such intellectual property remains the property of its respective owners, and any references here are made solely for identification or informational purposes, without implying any affiliation, endorsement, or partnership.
We make no representations or warranties, express or implied, regarding the accuracy, completeness, or suitability of any content or products presented. Nothing on this website should be construed as legal, tax, investment, financial, medical, or other professional advice. In addition, no part of this site—including articles or product references—constitutes a solicitation, recommendation, endorsement, advertisement, or offer to buy or sell any securities, franchises, or other financial instruments, particularly in jurisdictions where such activity would be unlawful.
All content is of a general nature and may not address the specific circumstances of any individual or entity. It is not a substitute for professional advice or services. Any actions you take based on the information provided here are strictly at your own risk. You accept full responsibility for any decisions or outcomes arising from your use of this website and agree to release us from any liability in connection with your use of, or reliance upon, the content or products found herein.