
|
Geovis Technology Co., Ltd (688568.SS) DCF -Bewertung |
Fully Editable: Tailor To Your Needs In Excel Or Sheets
Professional Design: Trusted, Industry-Standard Templates
Investor-Approved Valuation Models
MAC/PC Compatible, Fully Unlocked
No Expertise Is Needed; Easy To Follow
Geovis Technology Co.,Ltd (688568.SS) Bundle
Entdecken Sie das finanzielle Potenzial von Geovis Technology Co., Ltd mit unserem benutzerfreundlichen DCF-Taschenrechner! Geben Sie Ihre Prognosen für Wachstum, Margen und Kosten ein, um den inneren Wert von Geovis Technology Co., Ltd (688568S) zu berechnen und Ihren Investitionsansatz zu verbessern.
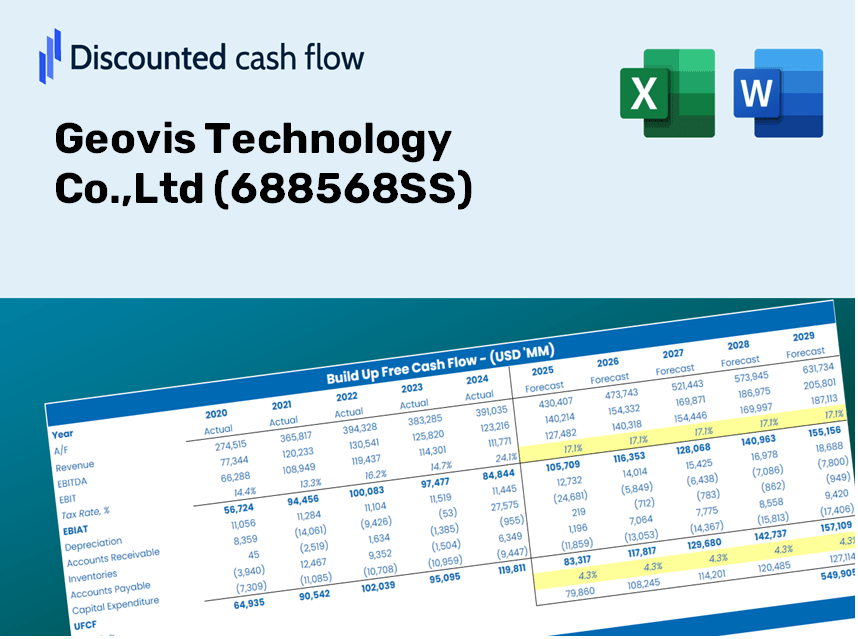
Discounted Cash Flow (DCF) - (USD MM)
| Year | AY1 2020 |
AY2 2021 |
AY3 2022 |
AY4 2023 |
AY5 2024 |
FY1 2025 |
FY2 2026 |
FY3 2027 |
FY4 2028 |
FY5 2029 |
|---|---|---|---|---|---|---|---|---|---|---|
| Revenue | 702.5 | 1,039.9 | 1,576.7 | 2,515.6 | 3,257.4 | 4,793.9 | 7,055.2 | 10,383.1 | 15,280.7 | 22,488.5 |
| Revenue Growth, % | 0 | 48.03 | 51.62 | 59.54 | 29.49 | 47.17 | 47.17 | 47.17 | 47.17 | 47.17 |
| EBITDA | 153.0 | 192.5 | 255.0 | 427.3 | 484.5 | 846.8 | 1,246.2 | 1,834.1 | 2,699.2 | 3,972.4 |
| EBITDA, % | 21.78 | 18.51 | 16.17 | 16.99 | 14.87 | 17.66 | 17.66 | 17.66 | 17.66 | 17.66 |
| Depreciation | 15.3 | 20.9 | 40.4 | 77.9 | 59.6 | 111.9 | 164.8 | 242.5 | 356.8 | 525.1 |
| Depreciation, % | 2.17 | 2.01 | 2.57 | 3.1 | 1.83 | 2.34 | 2.34 | 2.34 | 2.34 | 2.34 |
| EBIT | 137.7 | 171.6 | 214.5 | 349.4 | 424.8 | 734.9 | 1,081.5 | 1,591.6 | 2,342.4 | 3,447.3 |
| EBIT, % | 19.61 | 16.5 | 13.61 | 13.89 | 13.04 | 15.33 | 15.33 | 15.33 | 15.33 | 15.33 |
| Total Cash | 905.5 | 1,068.7 | 1,996.2 | 1,688.8 | 1,312.8 | 3,906.4 | 5,749.1 | 8,460.9 | 12,451.8 | 18,325.2 |
| Total Cash, percent | .0 | .0 | .0 | .0 | .0 | .0 | .0 | .0 | .0 | .0 |
| Account Receivables | 548.0 | 820.2 | 1,428.7 | .0 | 3,333.0 | 3,331.6 | 4,903.1 | 7,215.9 | 10,619.6 | 15,628.8 |
| Account Receivables, % | 78.01 | 78.87 | 90.61 | 0 | 102.32 | 69.5 | 69.5 | 69.5 | 69.5 | 69.5 |
| Inventories | 99.2 | 167.2 | 388.8 | 391.0 | 695.4 | 879.8 | 1,294.8 | 1,905.5 | 2,804.3 | 4,127.1 |
| Inventories, % | 14.13 | 16.08 | 24.66 | 15.54 | 21.35 | 18.35 | 18.35 | 18.35 | 18.35 | 18.35 |
| Accounts Payable | 148.3 | 363.8 | 643.5 | 1,244.0 | 1,897.8 | 1,961.8 | 2,887.2 | 4,249.1 | 6,253.4 | 9,203.1 |
| Accounts Payable, % | 21.11 | 34.98 | 40.81 | 49.45 | 58.26 | 40.92 | 40.92 | 40.92 | 40.92 | 40.92 |
| Capital Expenditure | -15.4 | -65.9 | -336.3 | -376.5 | -457.3 | -564.4 | -830.6 | -1,222.3 | -1,798.9 | -2,647.4 |
| Capital Expenditure, % | -2.19 | -6.33 | -21.33 | -14.97 | -14.04 | -11.77 | -11.77 | -11.77 | -11.77 | -11.77 |
| Tax Rate, % | 36.13 | 36.13 | 36.13 | 36.13 | 36.13 | 36.13 | 36.13 | 36.13 | 36.13 | 36.13 |
| EBITAT | 123.1 | 144.4 | 162.7 | 227.6 | 271.3 | 556.1 | 818.4 | 1,204.5 | 1,772.7 | 2,608.8 |
| Depreciation | ||||||||||
| Changes in Account Receivables | ||||||||||
| Changes in Inventories | ||||||||||
| Changes in Accounts Payable | ||||||||||
| Capital Expenditure | ||||||||||
| UFCF | -376.0 | -25.2 | -683.5 | 1,956.1 | -3,110.0 | -15.3 | -908.5 | -1,337.0 | -1,967.6 | -2,895.8 |
| WACC, % | 4.63 | 4.62 | 4.61 | 4.59 | 4.59 | 4.61 | 4.61 | 4.61 | 4.61 | 4.61 |
| PV UFCF | ||||||||||
| SUM PV UFCF | -5,967.7 | |||||||||
| Long Term Growth Rate, % | 4.00 | |||||||||
| Free cash flow (T + 1) | -3,012 | |||||||||
| Terminal Value | -495,270 | |||||||||
| Present Terminal Value | -395,381 | |||||||||
| Enterprise Value | -401,349 | |||||||||
| Net Debt | -345 | |||||||||
| Equity Value | -401,004 | |||||||||
| Diluted Shares Outstanding, MM | 542 | |||||||||
| Equity Value Per Share | -739.68 |
What You Will Receive
- Authentic Geovis Financial Data: Access historical and projected figures for precise valuation.
- Customizable Parameters: Adjust WACC, tax rates, revenue growth, and capital spending.
- Automatic Calculations: Intrinsic value and NPV are calculated in real-time.
- Scenario Analysis: Analyze various scenarios to assess Geovis's future prospects.
- User-Friendly Design: Designed for professionals while remaining accessible to newcomers.
Key Features
- Comprehensive Data: Geovis Technology Co., Ltd's historical financials and pre-filled forecasts.
- Customizable Inputs: Adjust WACC, tax rates, revenue growth, and EBITDA margins as needed.
- Real-Time Analysis: Watch Geovis's intrinsic value update instantly.
- Intuitive Visuals: Dashboard charts present valuation results and essential metrics clearly.
- Designed for Precision: A robust tool tailored for analysts, investors, and finance professionals.
How It Functions
- Step 1: Download the Excel spreadsheet.
- Step 2: Examine the pre-filled data for Geovis Technology Co., Ltd (688568SS) (historical and forecasted).
- Step 3: Modify key assumptions (highlighted in yellow) according to your evaluation.
- Step 4: Observe automatic updates for the intrinsic value of Geovis Technology Co., Ltd (688568SS).
- Step 5: Utilize the results for making investment choices or for reporting purposes.
Why Opt for Geovis Technology Co., Ltd. Calculator?
- Precision: Utilizes accurate Geovis financial data for reliable results.
- Versatility: Built to allow users to experiment and adjust inputs seamlessly.
- Efficiency: Eliminate the complexity of constructing a financial model from the ground up.
- High-Quality: Crafted with the expertise and standards expected by CFOs.
- Intuitive: User-friendly interface makes it accessible for all skill levels.
Who Can Benefit from Geovis Technology Co., Ltd (688568SS)?
- Investors: Evaluate Geovis's market value before making investment decisions.
- CFOs and Financial Analysts: Optimize valuation methodologies and assess financial forecasts.
- Startup Founders: Gain insights into how leading technology firms like Geovis are evaluated.
- Consultants: Create detailed valuation reports for clients leveraging Geovis's data.
- Students and Educators: Utilize real-time information to learn and teach valuation strategies.
What the Template Includes
- Preloaded Geovis Technology Data: Historical and projected financial information, encompassing revenue, EBIT, and capital expenditures.
- DCF and WACC Models: Advanced spreadsheets for determining intrinsic value and Weighted Average Cost of Capital.
- Editable Inputs: Cells highlighted in yellow for modifying revenue growth, tax rates, and discount rates.
- Financial Statements: Detailed annual and quarterly financial reports for in-depth analysis.
- Key Ratios: Metrics on profitability, leverage, and efficiency for performance evaluation.
- Dashboard and Charts: Visual representations of valuation results and underlying assumptions.
Disclaimer
All information, articles, and product details provided on this website are for general informational and educational purposes only. We do not claim any ownership over, nor do we intend to infringe upon, any trademarks, copyrights, logos, brand names, or other intellectual property mentioned or depicted on this site. Such intellectual property remains the property of its respective owners, and any references here are made solely for identification or informational purposes, without implying any affiliation, endorsement, or partnership.
We make no representations or warranties, express or implied, regarding the accuracy, completeness, or suitability of any content or products presented. Nothing on this website should be construed as legal, tax, investment, financial, medical, or other professional advice. In addition, no part of this site—including articles or product references—constitutes a solicitation, recommendation, endorsement, advertisement, or offer to buy or sell any securities, franchises, or other financial instruments, particularly in jurisdictions where such activity would be unlawful.
All content is of a general nature and may not address the specific circumstances of any individual or entity. It is not a substitute for professional advice or services. Any actions you take based on the information provided here are strictly at your own risk. You accept full responsibility for any decisions or outcomes arising from your use of this website and agree to release us from any liability in connection with your use of, or reliance upon, the content or products found herein.