
|
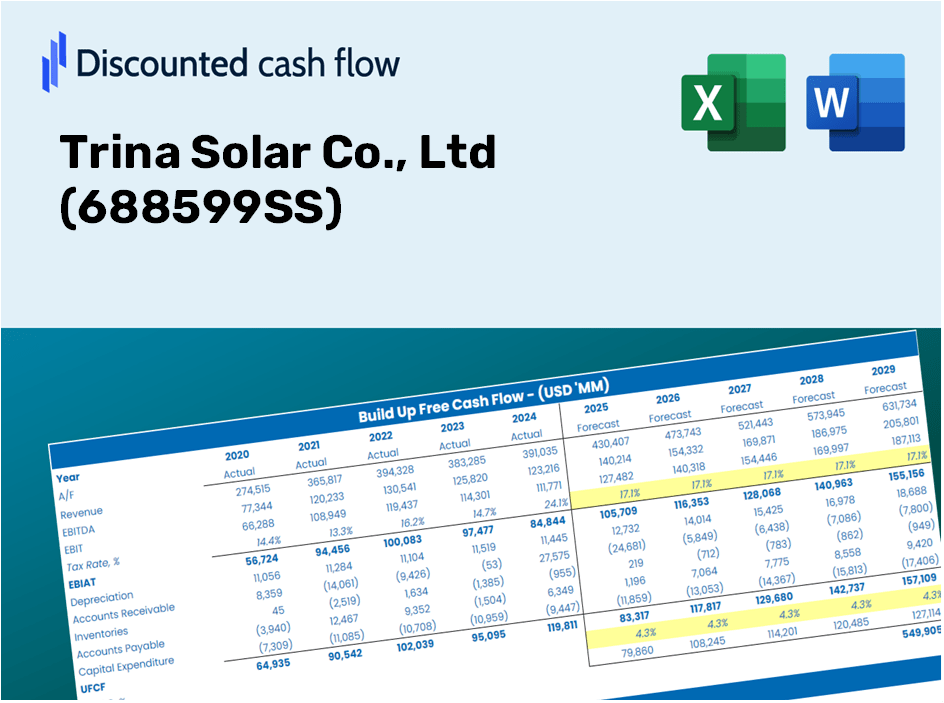
Trina Solar Co., Ltd (688599.Sss) DCF -Bewertung |
Fully Editable: Tailor To Your Needs In Excel Or Sheets
Professional Design: Trusted, Industry-Standard Templates
Investor-Approved Valuation Models
MAC/PC Compatible, Fully Unlocked
No Expertise Is Needed; Easy To Follow
Trina Solar Co., Ltd (688599.SS) Bundle
Vereinfachen Sie die Bewertung von Trina Solar Co., Ltd mit diesem anpassbaren DCF -Taschenrechner! Mit Real Trina Solar Co., Ltd Financials und einstellbaren Prognoseeingaben können Sie Szenarien testen und Trina Solar Co., Ltd Fair Value in Minuten aufdecken.
Discounted Cash Flow (DCF) - (USD MM)
| Year | AY1 2020 |
AY2 2021 |
AY3 2022 |
AY4 2023 |
AY5 2024 |
FY1 2025 |
FY2 2026 |
FY3 2027 |
FY4 2028 |
FY5 2029 |
|---|---|---|---|---|---|---|---|---|---|---|
| Revenue | 32,061.5 | 49,795.6 | 87,732.7 | 113,675.9 | 78,251.3 | 103,664.7 | 137,331.4 | 181,931.9 | 241,017.1 | 319,291.1 |
| Revenue Growth, % | 0 | 55.31 | 76.19 | 29.57 | -31.16 | 32.48 | 32.48 | 32.48 | 32.48 | 32.48 |
| EBITDA | 3,275.6 | 3,750.9 | 6,968.1 | 10,774.5 | 2,794.0 | 8,032.0 | 10,640.5 | 14,096.2 | 18,674.2 | 24,738.9 |
| EBITDA, % | 10.22 | 7.53 | 7.94 | 9.48 | 3.57 | 7.75 | 7.75 | 7.75 | 7.75 | 7.75 |
| Depreciation | 1,245.9 | 1,415.6 | 2,235.7 | 3,213.1 | 5,371.2 | 3,932.5 | 5,209.7 | 6,901.6 | 9,143.0 | 12,112.4 |
| Depreciation, % | 3.89 | 2.84 | 2.55 | 2.83 | 6.86 | 3.79 | 3.79 | 3.79 | 3.79 | 3.79 |
| EBIT | 2,029.7 | 2,335.3 | 4,732.4 | 7,561.4 | -2,577.2 | 4,099.5 | 5,430.9 | 7,194.6 | 9,531.2 | 12,626.6 |
| EBIT, % | 6.33 | 4.69 | 5.39 | 6.65 | -3.29 | 3.95 | 3.95 | 3.95 | 3.95 | 3.95 |
| Total Cash | 73,591.8 | 79,112.3 | 136,826.2 | 173,432.1 | 160,298.9 | 103,664.7 | 137,331.4 | 181,931.9 | 241,017.1 | 319,291.1 |
| Total Cash, percent | .0 | .0 | .0 | .0 | .0 | .0 | .0 | .0 | .0 | .0 |
| Account Receivables | 65,151.6 | 13,264.0 | 148,000.7 | 188,474.2 | 145,584.0 | 88,454.3 | 117,181.3 | 155,237.7 | 205,653.6 | 272,442.8 |
| Account Receivables, % | 203.21 | 26.64 | 168.69 | 165.8 | 186.05 | 85.33 | 85.33 | 85.33 | 85.33 | 85.33 |
| Inventories | 50,657.4 | 90,733.8 | 133,143.9 | 166,504.2 | 158,939.0 | 103,664.7 | 137,331.4 | 181,931.9 | 241,017.1 | 319,291.1 |
| Inventories, % | 158 | 182.21 | 151.76 | 146.47 | 203.11 | 100 | 100 | 100 | 100 | 100 |
| Accounts Payable | 106,937.0 | 133,098.9 | 214,242.2 | 282,043.9 | 231,017.0 | 103,664.7 | 137,331.4 | 181,931.9 | 241,017.1 | 319,291.1 |
| Accounts Payable, % | 333.54 | 267.29 | 244.2 | 248.11 | 295.22 | 100 | 100 | 100 | 100 | 100 |
| Capital Expenditure | -33,665.3 | -46,187.9 | -57,685.5 | -134,905.5 | -94,528.7 | -95,061.8 | -125,934.6 | -166,833.8 | -221,015.7 | -292,794.0 |
| Capital Expenditure, % | -105 | -92.75 | -65.75 | -118.68 | -120.8 | -91.7 | -91.7 | -91.7 | -91.7 | -91.7 |
| Tax Rate, % | 5.92 | 5.92 | 5.92 | 5.92 | 5.92 | 5.92 | 5.92 | 5.92 | 5.92 | 5.92 |
| EBITAT | 1,773.4 | 1,853.2 | 4,372.7 | 6,401.6 | -2,424.7 | 3,590.1 | 4,756.0 | 6,300.6 | 8,346.8 | 11,057.6 |
| Depreciation | ||||||||||
| Changes in Account Receivables | ||||||||||
| Changes in Inventories | ||||||||||
| Changes in Accounts Payable | ||||||||||
| Capital Expenditure | ||||||||||
| UFCF | -39,518.0 | -4,946.1 | -147,080.4 | -131,323.0 | -92,153.7 | -102,487.6 | -144,695.8 | -191,688.0 | -253,941.7 | -336,413.2 |
| WACC, % | 4.85 | 4.48 | 5.09 | 4.73 | 5.17 | 4.86 | 4.86 | 4.86 | 4.86 | 4.86 |
| PV UFCF | ||||||||||
| SUM PV UFCF | -870,928.1 | |||||||||
| Long Term Growth Rate, % | 2.00 | |||||||||
| Free cash flow (T + 1) | -343,141 | |||||||||
| Terminal Value | -11,991,536 | |||||||||
| Present Terminal Value | -9,457,881 | |||||||||
| Enterprise Value | -10,328,809 | |||||||||
| Net Debt | 120,184 | |||||||||
| Equity Value | -10,448,993 | |||||||||
| Diluted Shares Outstanding, MM | 2,166 | |||||||||
| Equity Value Per Share | -4,825.11 |
What You Will Receive
- Adjustable Forecast Inputs: Easily modify key assumptions (growth %, margins, WACC) to explore various scenarios.
- Comprehensive Data: Trina Solar's financial information pre-filled to kickstart your analysis.
- Automated DCF Outputs: The template computes Net Present Value (NPV) and intrinsic value for you.
- Customizable and Professional Design: A sleek Excel model that fits your valuation requirements.
- Designed for Analysts and Investors: Perfect for evaluating projections, confirming strategies, and enhancing efficiency.
Key Features
- Genuine Trina Solar Financials: Gain access to precise, pre-loaded historical data and future forecasts.
- Adjustable Forecast Inputs: Modify the yellow-highlighted fields such as WACC, growth rates, and profit margins.
- Real-Time Calculations: Automatic updates for DCF, Net Present Value (NPV), and cash flow assessments.
- User-Friendly Dashboard: Clear charts and summaries to help you visualize your valuation outcomes.
- Suitable for All Skill Levels: An intuitive layout designed for investors, CFOs, and consultants alike.
How It Functions
- Step 1: Download the Excel file.
- Step 2: Examine Trina Solar’s pre-filled financial information and projections.
- Step 3: Adjust key inputs such as revenue growth, WACC, and tax rates (highlighted cells).
- Step 4: Observe the DCF model refresh in real time as you modify your assumptions.
- Step 5: Evaluate the outputs and utilize the results for informed investment decisions regarding Trina Solar Co., Ltd (688599SS).
Why Choose Trina Solar's Calculator?
- Save Time: Get started instantly with our pre-built DCF model – no setup required.
- Enhance Accuracy: Dependable financial data and established formulas minimize valuation mistakes.
- Completely Customizable: Adjust the model to fit your specific assumptions and forecasts.
- User-Friendly: Intuitive charts and outputs simplify the analysis of results.
- Endorsed by Professionals: Crafted for experts who prioritize precision and usability.
Who Can Benefit from This Product?
- Investors: Assess Trina Solar's fair value effectively before making investment choices.
- CFOs: Utilize a top-tier DCF model for comprehensive financial reporting and analysis.
- Consultants: Easily modify the template for client valuation reports.
- Entrepreneurs: Acquire knowledge of financial modeling practices used by leading solar companies.
- Educators: Employ it as a resource to illustrate valuation techniques.
Overview of the Template Features
- Pre-Filled DCF Model: Trina Solar’s financial data preloaded for immediate application.
- WACC Calculator: Comprehensive calculations for the Weighted Average Cost of Capital.
- Financial Ratios: Assess Trina Solar’s profitability, leverage, and operational efficiency.
- Editable Inputs: Modify assumptions such as growth rates, profit margins, and capital expenditures to suit your analysis.
- Financial Statements: Access annual and quarterly reports for in-depth evaluation.
- Interactive Dashboard: Effortlessly visualize essential valuation metrics and outcomes.
Disclaimer
All information, articles, and product details provided on this website are for general informational and educational purposes only. We do not claim any ownership over, nor do we intend to infringe upon, any trademarks, copyrights, logos, brand names, or other intellectual property mentioned or depicted on this site. Such intellectual property remains the property of its respective owners, and any references here are made solely for identification or informational purposes, without implying any affiliation, endorsement, or partnership.
We make no representations or warranties, express or implied, regarding the accuracy, completeness, or suitability of any content or products presented. Nothing on this website should be construed as legal, tax, investment, financial, medical, or other professional advice. In addition, no part of this site—including articles or product references—constitutes a solicitation, recommendation, endorsement, advertisement, or offer to buy or sell any securities, franchises, or other financial instruments, particularly in jurisdictions where such activity would be unlawful.
All content is of a general nature and may not address the specific circumstances of any individual or entity. It is not a substitute for professional advice or services. Any actions you take based on the information provided here are strictly at your own risk. You accept full responsibility for any decisions or outcomes arising from your use of this website and agree to release us from any liability in connection with your use of, or reliance upon, the content or products found herein.