
|
Anhui Huaheng Biotechnology Co., Ltd. (688639.Sss) DCF -Bewertung |
Fully Editable: Tailor To Your Needs In Excel Or Sheets
Professional Design: Trusted, Industry-Standard Templates
Investor-Approved Valuation Models
MAC/PC Compatible, Fully Unlocked
No Expertise Is Needed; Easy To Follow
Anhui Huaheng Biotechnology Co., Ltd. (688639.SS) Bundle
Erforschen Sie die finanziellen Aussichten von Anhui Huaheng Biotechnology Co., Ltd. (688639S) mit unserem benutzerfreundlichen DCF-Taschenrechner! Geben Sie Ihre Annahmen in Bezug auf Wachstum, Margen und Kosten für die Berechnung des inneren Werts von Anhui Huaheng Biotechnology Co., Ltd. (688639S) ein und informieren Sie Ihre Anlageentscheidungen.
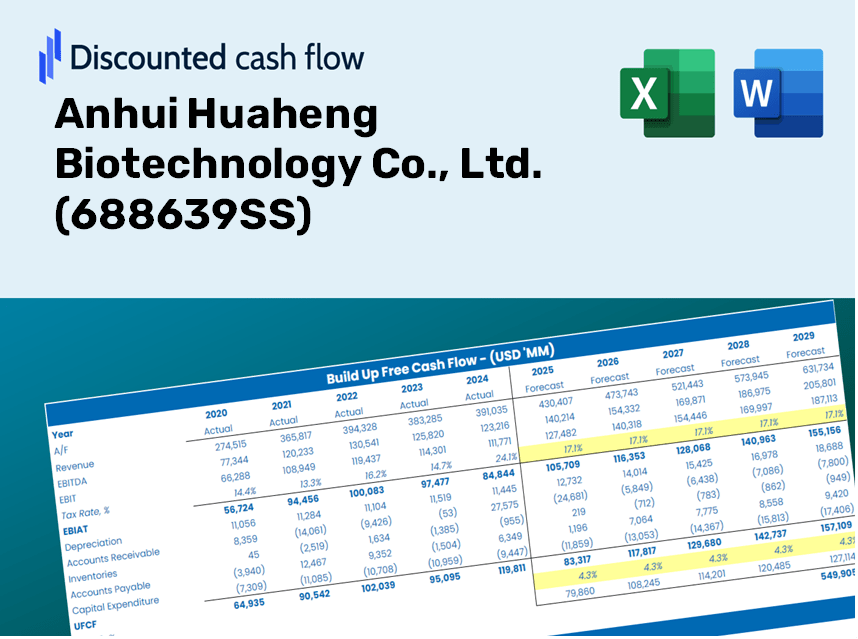
Discounted Cash Flow (DCF) - (USD MM)
| Year | AY1 2020 |
AY2 2021 |
AY3 2022 |
AY4 2023 |
AY5 2024 |
FY1 2025 |
FY2 2026 |
FY3 2027 |
FY4 2028 |
FY5 2029 |
|---|---|---|---|---|---|---|---|---|---|---|
| Revenue | 487.2 | 954.1 | 1,418.7 | 1,938.3 | 2,177.9 | 3,231.5 | 4,794.7 | 7,114.2 | 10,555.6 | 15,661.8 |
| Revenue Growth, % | 0 | 95.81 | 48.69 | 36.63 | 12.37 | 48.37 | 48.37 | 48.37 | 48.37 | 48.37 |
| EBITDA | 153.5 | 216.6 | 376.3 | 595.4 | 347.4 | 823.3 | 1,221.6 | 1,812.6 | 2,689.4 | 3,990.4 |
| EBITDA, % | 31.5 | 22.7 | 26.52 | 30.72 | 15.95 | 25.48 | 25.48 | 25.48 | 25.48 | 25.48 |
| Depreciation | 35.0 | 47.5 | 59.2 | 98.8 | 138.7 | 179.7 | 266.6 | 395.6 | 587.0 | 871.0 |
| Depreciation, % | 7.19 | 4.98 | 4.17 | 5.1 | 6.37 | 5.56 | 5.56 | 5.56 | 5.56 | 5.56 |
| EBIT | 118.4 | 169.1 | 317.1 | 496.6 | 208.8 | 643.6 | 955.0 | 1,417.0 | 2,102.4 | 3,119.5 |
| EBIT, % | 24.31 | 17.72 | 22.35 | 25.62 | 9.58 | 19.92 | 19.92 | 19.92 | 19.92 | 19.92 |
| Total Cash | 62.2 | 462.9 | 347.8 | 353.0 | 422.6 | 797.6 | 1,183.4 | 1,755.9 | 2,605.3 | 3,865.6 |
| Total Cash, percent | .0 | .0 | .0 | .0 | .0 | .0 | .0 | .0 | .0 | .0 |
| Account Receivables | 41.1 | 228.8 | 339.9 | 318.4 | 391.1 | 586.6 | 870.3 | 1,291.4 | 1,916.1 | 2,842.9 |
| Account Receivables, % | 8.43 | 23.98 | 23.96 | 16.43 | 17.96 | 18.15 | 18.15 | 18.15 | 18.15 | 18.15 |
| Inventories | 47.1 | 106.2 | 135.5 | 226.5 | 406.9 | 392.4 | 582.3 | 863.9 | 1,281.9 | 1,902.0 |
| Inventories, % | 9.67 | 11.13 | 9.55 | 11.68 | 18.68 | 12.14 | 12.14 | 12.14 | 12.14 | 12.14 |
| Accounts Payable | 86.8 | 99.9 | 221.6 | 589.0 | 564.0 | 647.6 | 960.9 | 1,425.7 | 2,115.3 | 3,138.6 |
| Accounts Payable, % | 17.82 | 10.47 | 15.62 | 30.39 | 25.9 | 20.04 | 20.04 | 20.04 | 20.04 | 20.04 |
| Capital Expenditure | -72.6 | -180.6 | -456.3 | -1,269.2 | -923.5 | -1,123.9 | -1,667.5 | -2,474.2 | -3,671.0 | -5,446.9 |
| Capital Expenditure, % | -14.91 | -18.93 | -32.17 | -65.48 | -42.4 | -34.78 | -34.78 | -34.78 | -34.78 | -34.78 |
| Tax Rate, % | 5.9 | 5.9 | 5.9 | 5.9 | 5.9 | 5.9 | 5.9 | 5.9 | 5.9 | 5.9 |
| EBITAT | 102.5 | 149.1 | 295.9 | 440.5 | 196.4 | 580.3 | 861.1 | 1,277.6 | 1,895.7 | 2,812.7 |
| Depreciation | ||||||||||
| Changes in Account Receivables | ||||||||||
| Changes in Inventories | ||||||||||
| Changes in Accounts Payable | ||||||||||
| Capital Expenditure | ||||||||||
| UFCF | 63.6 | -217.9 | -120.0 | -431.9 | -866.5 | -461.2 | -700.1 | -1,038.8 | -1,541.3 | -2,286.9 |
| WACC, % | 4.49 | 4.5 | 4.53 | 4.5 | 4.53 | 4.51 | 4.51 | 4.51 | 4.51 | 4.51 |
| PV UFCF | ||||||||||
| SUM PV UFCF | -5,118.4 | |||||||||
| Long Term Growth Rate, % | 3.50 | |||||||||
| Free cash flow (T + 1) | -2,367 | |||||||||
| Terminal Value | -234,111 | |||||||||
| Present Terminal Value | -187,763 | |||||||||
| Enterprise Value | -192,882 | |||||||||
| Net Debt | 897 | |||||||||
| Equity Value | -193,779 | |||||||||
| Diluted Shares Outstanding, MM | 231 | |||||||||
| Equity Value Per Share | -838.43 |
Benefits You Will Receive
- Authentic Anhui Huaheng Data: Comprehensive financial overview – ranging from revenue to EBIT – rooted in actual and forecasted figures.
- Complete Customization Options: Modify essential parameters (yellow cells) such as WACC, growth %, and tax rates according to your preferences.
- Real-Time Valuation Adjustments: Automatic recalculations that allow you to evaluate the effects of changes on Anhui Huaheng's fair value.
- Flexible Excel Template: Designed for efficient modifications, scenario analysis, and in-depth projections.
- Efficient and Precise: Eliminate the need to construct models from the ground up while ensuring accuracy and adaptability.
Key Features
- 🔍 Real-Time 688639SS Financials: Pre-filled historical and projected data for Anhui Huaheng Biotechnology Co., Ltd.
- ✏️ Fully Customizable Inputs: Modify all essential parameters (yellow cells) such as WACC, growth %, and tax rates.
- 📊 Comprehensive DCF Valuation: Integrated formulas to compute Anhui Huaheng’s intrinsic value utilizing the Discounted Cash Flow method.
- ⚡ Instant Results: Visualize Anhui Huaheng’s valuation immediately after adjustments.
- Scenario Analysis: Evaluate and contrast various financial assumptions side-by-side.
How It Functions
- Download: Obtain the pre-configured Excel file containing Anhui Huaheng Biotechnology's financial data.
- Customize: Modify projections, including revenue growth, EBITDA %, and WACC.
- Auto-Update: The intrinsic value and NPV calculations refresh automatically in real-time.
- Scenario Testing: Generate various projections and instantly compare the results.
- Make Informed Decisions: Utilize the valuation insights to shape your investment approach.
Why Opt for This Calculator?
- Designed for Experts: A sophisticated tool favored by analysts, CFOs, and industry consultants.
- Comprehensive Data: Anhui Huaheng Biotechnology Co., Ltd.’s (688639SS) historical and projected financials are preloaded for enhanced precision.
- Flexible Scenario Analysis: Effortlessly test various forecasts and assumptions.
- Transparent Results: Automatically computes intrinsic value, NPV, and essential financial metrics.
- User-Friendly: Step-by-step guidance ensures an intuitive experience throughout the process.
Who Should Use This Product?
- Professional Investors: Develop comprehensive and accurate valuation models for portfolio assessments related to Anhui Huaheng Biotechnology Co., Ltd. (688639SS).
- Corporate Finance Teams: Evaluate valuation scenarios to inform strategic decision-making within the company.
- Consultants and Advisors: Equip clients with precise valuation insights for Anhui Huaheng Biotechnology Co., Ltd. (688639SS).
- Students and Educators: Utilize real-world data to enhance financial modeling skills and educational experiences.
- Biotechnology Enthusiasts: Gain insight into how biotechnology companies like Anhui Huaheng Biotechnology Co., Ltd. (688639SS) are valued in the marketplace.
Contents of the Template
- Pre-Filled Data: Contains Anhui Huaheng Biotechnology's historical financials and projections.
- Discounted Cash Flow Model: Customizable DCF valuation model with automated calculations.
- Weighted Average Cost of Capital (WACC): A specific sheet for WACC calculations based on user-defined inputs.
- Key Financial Ratios: Evaluate Anhui Huaheng's profitability, efficiency, and financial leverage.
- Customizable Inputs: Easily modify revenue growth rates, profit margins, and tax obligations.
- Clear Dashboard: Visual representations and tables that summarize essential valuation outcomes.
Disclaimer
All information, articles, and product details provided on this website are for general informational and educational purposes only. We do not claim any ownership over, nor do we intend to infringe upon, any trademarks, copyrights, logos, brand names, or other intellectual property mentioned or depicted on this site. Such intellectual property remains the property of its respective owners, and any references here are made solely for identification or informational purposes, without implying any affiliation, endorsement, or partnership.
We make no representations or warranties, express or implied, regarding the accuracy, completeness, or suitability of any content or products presented. Nothing on this website should be construed as legal, tax, investment, financial, medical, or other professional advice. In addition, no part of this site—including articles or product references—constitutes a solicitation, recommendation, endorsement, advertisement, or offer to buy or sell any securities, franchises, or other financial instruments, particularly in jurisdictions where such activity would be unlawful.
All content is of a general nature and may not address the specific circumstances of any individual or entity. It is not a substitute for professional advice or services. Any actions you take based on the information provided here are strictly at your own risk. You accept full responsibility for any decisions or outcomes arising from your use of this website and agree to release us from any liability in connection with your use of, or reliance upon, the content or products found herein.