
|
Hainan Jinpan Smart Technology Co., Ltd. (688676.SS) DCF -Bewertung |
Fully Editable: Tailor To Your Needs In Excel Or Sheets
Professional Design: Trusted, Industry-Standard Templates
Investor-Approved Valuation Models
MAC/PC Compatible, Fully Unlocked
No Expertise Is Needed; Easy To Follow
Hainan Jinpan Smart Technology Co., Ltd. (688676.SS) Bundle
Enthüllen Sie den wahren Wert von Hainan Jinpan Smart Technology Co., Ltd. (688676Ss) mit unserem DCF-Taschenrechner von professionellem Qualitätsqualität! Passen Sie die wichtigsten Annahmen an, erkunden Sie verschiedene Szenarien und beurteilen Sie, wie sich Änderungen auf die Bewertung von Hainan Jinpan auswirken - alles innerhalb einer einzigen Excel -Vorlage.
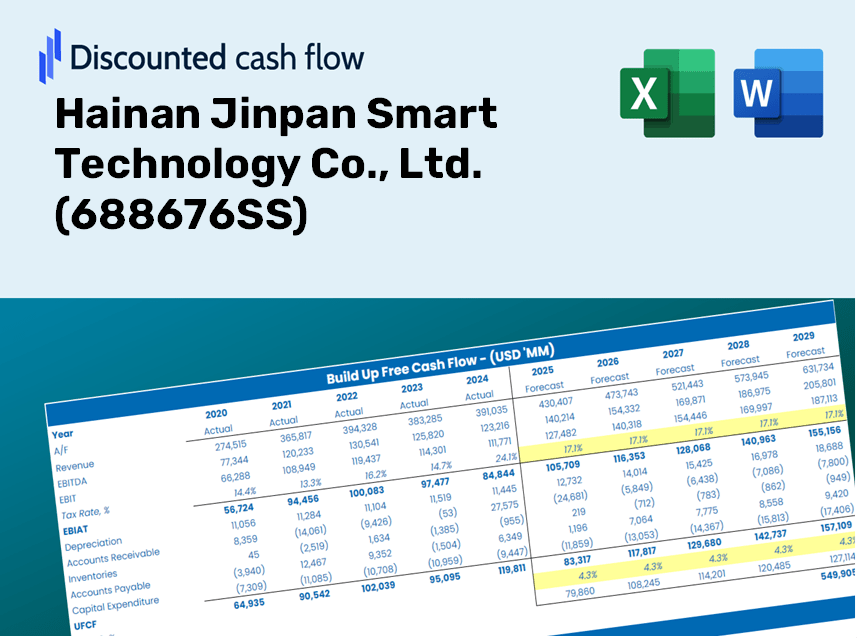
Discounted Cash Flow (DCF) - (USD MM)
| Year | AY1 2020 |
AY2 2021 |
AY3 2022 |
AY4 2023 |
AY5 2024 |
FY1 2025 |
FY2 2026 |
FY3 2027 |
FY4 2028 |
FY5 2029 |
|---|---|---|---|---|---|---|---|---|---|---|
| Revenue | 2,422.7 | 3,302.6 | 4,745.6 | 6,667.6 | 6,900.9 | 9,040.4 | 11,843.2 | 15,515.0 | 20,325.1 | 26,626.6 |
| Revenue Growth, % | 0 | 36.32 | 43.69 | 40.5 | 3.5 | 31 | 31 | 31 | 31 | 31 |
| EBITDA | 316.4 | 344.8 | 340.4 | 734.3 | 843.6 | 974.8 | 1,277.0 | 1,672.9 | 2,191.5 | 2,871.0 |
| EBITDA, % | 13.06 | 10.44 | 7.17 | 11.01 | 12.23 | 10.78 | 10.78 | 10.78 | 10.78 | 10.78 |
| Depreciation | 57.1 | 77.6 | 94.1 | 151.8 | 213.1 | 218.0 | 285.6 | 374.1 | 490.1 | 642.1 |
| Depreciation, % | 2.36 | 2.35 | 1.98 | 2.28 | 3.09 | 2.41 | 2.41 | 2.41 | 2.41 | 2.41 |
| EBIT | 259.3 | 267.1 | 246.2 | 582.4 | 630.5 | 756.8 | 991.4 | 1,298.7 | 1,701.4 | 2,228.9 |
| EBIT, % | 10.7 | 8.09 | 5.19 | 8.74 | 9.14 | 8.37 | 8.37 | 8.37 | 8.37 | 8.37 |
| Total Cash | 541.7 | 1,059.4 | 1,264.1 | 793.5 | 560.4 | 1,827.9 | 2,394.6 | 3,137.0 | 4,109.5 | 5,383.6 |
| Total Cash, percent | .0 | .0 | .0 | .0 | .0 | .0 | .0 | .0 | .0 | .0 |
| Account Receivables | 1,302.2 | 1,480.1 | 2,168.3 | 3,156.7 | 3,880.5 | 4,481.1 | 5,870.3 | 7,690.4 | 10,074.6 | 13,198.1 |
| Account Receivables, % | 53.75 | 44.82 | 45.69 | 47.34 | 56.23 | 49.57 | 49.57 | 49.57 | 49.57 | 49.57 |
| Inventories | 1,050.6 | 1,424.4 | 1,732.8 | 1,735.6 | 2,119.4 | 3,250.1 | 4,257.7 | 5,577.7 | 7,307.0 | 9,572.4 |
| Inventories, % | 43.37 | 43.13 | 36.51 | 26.03 | 30.71 | 35.95 | 35.95 | 35.95 | 35.95 | 35.95 |
| Accounts Payable | 1,147.0 | 1,421.6 | 2,141.0 | 2,388.1 | 2,504.4 | 3,753.8 | 4,917.6 | 6,442.2 | 8,439.5 | 11,056.1 |
| Accounts Payable, % | 47.34 | 43.04 | 45.12 | 35.82 | 36.29 | 41.52 | 41.52 | 41.52 | 41.52 | 41.52 |
| Capital Expenditure | -230.6 | -231.9 | -536.8 | -919.0 | -435.0 | -866.8 | -1,135.5 | -1,487.6 | -1,948.8 | -2,553.0 |
| Capital Expenditure, % | -9.52 | -7.02 | -11.31 | -13.78 | -6.3 | -9.59 | -9.59 | -9.59 | -9.59 | -9.59 |
| Tax Rate, % | 6.89 | 6.89 | 6.89 | 6.89 | 6.89 | 6.89 | 6.89 | 6.89 | 6.89 | 6.89 |
| EBITAT | 230.9 | 243.4 | 263.3 | 533.0 | 587.1 | 703.4 | 921.5 | 1,207.2 | 1,581.5 | 2,071.8 |
| Depreciation | ||||||||||
| Changes in Account Receivables | ||||||||||
| Changes in Inventories | ||||||||||
| Changes in Accounts Payable | ||||||||||
| Capital Expenditure | ||||||||||
| UFCF | -1,148.4 | -188.1 | -456.5 | -978.3 | -626.0 | -427.2 | -1,161.5 | -1,521.7 | -1,993.4 | -2,611.5 |
| WACC, % | 4.68 | 4.68 | 4.69 | 4.68 | 4.68 | 4.68 | 4.68 | 4.68 | 4.68 | 4.68 |
| PV UFCF | ||||||||||
| SUM PV UFCF | -6,531.6 | |||||||||
| Long Term Growth Rate, % | 4.00 | |||||||||
| Free cash flow (T + 1) | -2,716 | |||||||||
| Terminal Value | -397,251 | |||||||||
| Present Terminal Value | -315,988 | |||||||||
| Enterprise Value | -322,519 | |||||||||
| Net Debt | 508 | |||||||||
| Equity Value | -323,027 | |||||||||
| Diluted Shares Outstanding, MM | 445 | |||||||||
| Equity Value Per Share | -725.43 |
Benefits You Will Receive
- Comprehensive Financial Model: Utilize Hainan Jinpan Smart Technology Co., Ltd.'s (688676SS) real data for accurate DCF valuation.
- Full Customization Control: Modify revenue growth rates, profit margins, WACC, and other essential parameters.
- Real-Time Calculations: Immediate updates provide instant feedback as you make adjustments.
- Professional-Grade Template: An expertly crafted Excel file tailored for high-quality valuations.
- Flexible and Reusable: Designed for adaptability, making it suitable for ongoing detailed forecasts.
Key Features
- Comprehensive DCF Calculator: Features detailed unlevered and levered DCF valuation models tailored for Hainan Jinpan Smart Technology Co., Ltd. (688676SS).
- WACC Calculator: Comes with a pre-defined Weighted Average Cost of Capital sheet that allows for customizable inputs.
- Adjustable Forecast Assumptions: Easily modify growth rates, capital expenditures, and discount rates to fit your analysis.
- Integrated Financial Ratios: Evaluate profitability, leverage, and efficiency ratios specific to Hainan Jinpan Smart Technology Co., Ltd. (688676SS).
- Visualization Dashboard and Charts: Offers visual representations of key valuation metrics for straightforward analysis.
How It Functions
- Step 1: Download the Excel spreadsheet.
- Step 2: Examine the pre-filled Hainan Jinpan data (historical and projected).
- Step 3: Modify key assumptions (highlighted in yellow) based on your findings.
- Step 4: Observe the automatic updates for Hainan Jinpan’s intrinsic value.
- Step 5: Leverage the results for your investment strategies or reporting.
Why Choose This Calculator for Hainan Jinpan Smart Technology Co., Ltd. (688676SS)?
- User-Friendly Interface: Crafted for both novice users and seasoned professionals.
- Customizable Inputs: Easily adjust parameters to suit your analysis needs.
- Real-Time Valuation Updates: Watch Hainan Jinpan's valuation change instantly as you tweak the inputs.
- Pre-Filled Data: Comes preloaded with Hainan Jinpan's current financial information for swift assessments.
- Preferred by Industry Experts: Widely utilized by investors and analysts for making well-informed decisions.
Who Can Benefit from This Product?
- Engineering Students: Discover innovative technologies and implement them using hands-on projects.
- Researchers: Utilize advanced models and methodologies for cutting-edge studies.
- Investors: Evaluate your strategies and assess market performance for Hainan Jinpan Smart Technology Co., Ltd. (688676SS).
- Data Analysts: Enhance your processes with a customizable analytics framework tailored for tech innovations.
- Small Business Owners: Understand how large tech firms like Hainan Jinpan are positioned in the market.
What the Template Includes
- Historical Data: Provides Hainan Jinpan Smart Technology's past financial performance and foundational forecasts.
- DCF and Levered DCF Models: Comprehensive templates for calculating the intrinsic value of Hainan Jinpan Smart Technology (688676SS).
- WACC Sheet: Pre-configured calculations for the Weighted Average Cost of Capital.
- Editable Inputs: Adjust critical parameters such as growth rates, EBITDA %, and CAPEX assumptions.
- Quarterly and Annual Statements: A thorough analysis of Hainan Jinpan Smart Technology's financials.
- Interactive Dashboard: Dynamically visualize valuation results and future projections.
Disclaimer
All information, articles, and product details provided on this website are for general informational and educational purposes only. We do not claim any ownership over, nor do we intend to infringe upon, any trademarks, copyrights, logos, brand names, or other intellectual property mentioned or depicted on this site. Such intellectual property remains the property of its respective owners, and any references here are made solely for identification or informational purposes, without implying any affiliation, endorsement, or partnership.
We make no representations or warranties, express or implied, regarding the accuracy, completeness, or suitability of any content or products presented. Nothing on this website should be construed as legal, tax, investment, financial, medical, or other professional advice. In addition, no part of this site—including articles or product references—constitutes a solicitation, recommendation, endorsement, advertisement, or offer to buy or sell any securities, franchises, or other financial instruments, particularly in jurisdictions where such activity would be unlawful.
All content is of a general nature and may not address the specific circumstances of any individual or entity. It is not a substitute for professional advice or services. Any actions you take based on the information provided here are strictly at your own risk. You accept full responsibility for any decisions or outcomes arising from your use of this website and agree to release us from any liability in connection with your use of, or reliance upon, the content or products found herein.