
|
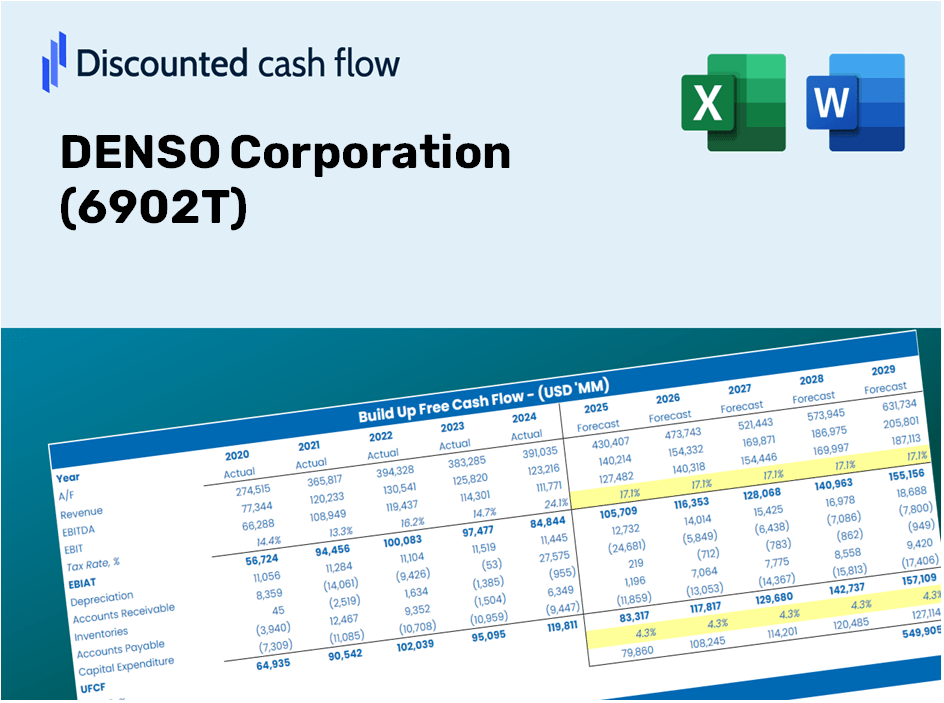
Denso Corporation (6902.t) DCF -Bewertung |
Fully Editable: Tailor To Your Needs In Excel Or Sheets
Professional Design: Trusted, Industry-Standard Templates
Investor-Approved Valuation Models
MAC/PC Compatible, Fully Unlocked
No Expertise Is Needed; Easy To Follow
DENSO Corporation (6902.T) Bundle
Sparen Sie Zeit und verbessern Sie die Präzision mit unserem DCF -Taschenrechner (6902T)! Dieses Tool kann mit authentischen Daten der Denso Corporation und anpassbaren Annahmen wie ein erfahrener Investor prognostizieren, analysieren und Wertschöpfungswert prognostizieren, analysieren und Wertschöpfung erhalten.
Discounted Cash Flow (DCF) - (USD MM)
| Year | AY1 2021 |
AY2 2022 |
AY3 2023 |
AY4 2024 |
AY5 2025 |
FY1 2026 |
FY2 2027 |
FY3 2028 |
FY4 2029 |
FY5 2030 |
|---|---|---|---|---|---|---|---|---|---|---|
| Revenue | 4,936,725.0 | 5,515,512.0 | 6,401,320.0 | 7,144,733.0 | 7,161,777.0 | 7,871,444.6 | 8,651,433.9 | 9,508,713.1 | 10,450,941.0 | 11,486,535.2 |
| Revenue Growth, % | 0 | 11.72 | 16.06 | 11.61 | 0.23855 | 9.91 | 9.91 | 9.91 | 9.91 | 9.91 |
| EBITDA | 561,382.0 | 765,385.0 | 875,109.0 | 846,451.0 | 971,409.0 | 1,012,744.2 | 1,113,098.0 | 1,223,396.0 | 1,344,623.5 | 1,477,863.6 |
| EBITDA, % | 11.37 | 13.88 | 13.67 | 11.85 | 13.56 | 12.87 | 12.87 | 12.87 | 12.87 | 12.87 |
| Depreciation | 363,805.0 | 379,533.0 | 403,115.0 | 412,936.0 | 376,593.0 | 497,253.1 | 546,526.4 | 600,682.2 | 660,204.4 | 725,624.8 |
| Depreciation, % | 7.37 | 6.88 | 6.3 | 5.78 | 5.26 | 6.32 | 6.32 | 6.32 | 6.32 | 6.32 |
| EBIT | 197,577.0 | 385,852.0 | 471,994.0 | 433,515.0 | 594,816.0 | 515,491.1 | 566,571.6 | 622,713.7 | 684,419.1 | 752,238.8 |
| EBIT, % | 4 | 7 | 7.37 | 6.07 | 8.31 | 6.55 | 6.55 | 6.55 | 6.55 | 6.55 |
| Total Cash | 912,922.0 | 885,538.0 | 767,566.0 | 789,390.0 | 986,531.0 | 1,123,446.0 | 1,234,769.4 | 1,357,123.9 | 1,491,602.7 | 1,639,407.1 |
| Total Cash, percent | .0 | .0 | .0 | .0 | .0 | .0 | .0 | .0 | .0 | .0 |
| Account Receivables | 1,028,821.0 | 1,120,781.0 | 1,263,768.0 | 1,281,279.0 | 1,242,986.0 | 1,514,340.1 | 1,664,397.6 | 1,829,324.4 | 2,010,594.0 | 2,209,825.8 |
| Account Receivables, % | 20.84 | 20.32 | 19.74 | 17.93 | 17.36 | 19.24 | 19.24 | 19.24 | 19.24 | 19.24 |
| Inventories | 726,159.0 | 1,032,161.0 | 1,119,780.0 | 1,172,257.0 | 1,203,066.0 | 1,324,319.9 | 1,455,548.1 | 1,599,779.8 | 1,758,303.6 | 1,932,535.6 |
| Inventories, % | 14.71 | 18.71 | 17.49 | 16.41 | 16.8 | 16.82 | 16.82 | 16.82 | 16.82 | 16.82 |
| Accounts Payable | 1,014,406.0 | 753,600.0 | 1,219,317.0 | 813,707.0 | 1,274,907.0 | 1,297,997.9 | 1,426,617.9 | 1,567,982.8 | 1,723,355.8 | 1,894,124.9 |
| Accounts Payable, % | 20.55 | 13.66 | 19.05 | 11.39 | 17.8 | 16.49 | 16.49 | 16.49 | 16.49 | 16.49 |
| Capital Expenditure | -434,681.0 | -372,144.0 | -414,314.0 | -446,405.0 | -380,071.0 | -528,639.3 | -581,022.7 | -638,596.8 | -701,876.0 | -771,425.6 |
| Capital Expenditure, % | -8.81 | -6.75 | -6.47 | -6.25 | -5.31 | -6.72 | -6.72 | -6.72 | -6.72 | -6.72 |
| Tax Rate, % | 26.35 | 26.35 | 26.35 | 26.35 | 26.35 | 26.35 | 26.35 | 26.35 | 26.35 | 26.35 |
| EBITAT | 127,523.1 | 264,617.0 | 325,048.5 | 310,839.3 | 438,090.4 | 358,105.5 | 393,590.5 | 432,591.8 | 475,457.7 | 522,571.3 |
| Depreciation | ||||||||||
| Changes in Account Receivables | ||||||||||
| Changes in Inventories | ||||||||||
| Changes in Accounts Payable | ||||||||||
| Capital Expenditure | ||||||||||
| UFCF | -683,926.9 | -386,762.0 | 548,960.5 | -198,227.7 | 903,296.4 | -42,797.9 | 206,428.4 | 226,883.6 | 249,365.8 | 274,075.7 |
| WACC, % | 5.87 | 5.88 | 5.88 | 5.89 | 5.9 | 5.88 | 5.88 | 5.88 | 5.88 | 5.88 |
| PV UFCF | ||||||||||
| SUM PV UFCF | 739,136.6 | |||||||||
| Long Term Growth Rate, % | 3.50 | |||||||||
| Free cash flow (T + 1) | 283,668 | |||||||||
| Terminal Value | 11,897,403 | |||||||||
| Present Terminal Value | 8,939,116 | |||||||||
| Enterprise Value | 9,678,252 | |||||||||
| Net Debt | -287,147 | |||||||||
| Equity Value | 9,965,399 | |||||||||
| Diluted Shares Outstanding, MM | 2,890 | |||||||||
| Equity Value Per Share | 3,448.37 |
What You Will Receive
- Customizable Excel Template: A fully adjustable Excel-based DCF Calculator featuring pre-populated financial data for DENSO Corporation (6902T).
- Real-Time Data: Access to historical performance data and forward-looking projections (highlighted in the yellow cells).
- Flexible Forecasting: Adjust key assumptions such as revenue growth, EBITDA margin, and WACC as needed.
- Instant Calculations: Quickly assess how your inputs influence DENSO Corporation's (6902T) valuation.
- Professional Resource: Designed for investors, CFOs, consultants, and financial analysts.
- User-Friendly Layout: Organized for simplicity and effectiveness, complete with clear, step-by-step instructions.
Key Features
- Real-Life DENSO Data: Pre-loaded with DENSO Corporation’s historical financials and projected forecasts.
- Fully Customizable Inputs: Adjust assumptions for revenue growth, profit margins, WACC, tax rates, and capital expenditures.
- Dynamic Valuation Model: Automatically refreshes Net Present Value (NPV) and intrinsic value based on your entered data.
- Scenario Testing: Develop various forecasting scenarios to evaluate different valuation results.
- User-Friendly Design: Intuitive, organized, and crafted for both professionals and newcomers.
How It Functions
- Step 1: Download the Excel file.
- Step 2: Examine the pre-filled DENSO Corporation (6902T) data (historical and projected).
- Step 3: Modify key assumptions (highlighted in yellow) according to your findings.
- Step 4: Observe automatic recalculations for DENSO Corporation’s intrinsic value.
- Step 5: Utilize the results for making investment choices or for reporting purposes.
Why Opt for This Calculator?
- Precise Metrics: Utilize authentic DENSO Corporation (6902T) financial data for trustworthy valuation outcomes.
- Tailorable: Modify essential factors such as growth rates, WACC, and tax rates to fit your specific forecasts.
- Efficient: Ready-made calculations save you time by eliminating the need to develop from the ground up.
- Professional-Quality Tool: Crafted for investors, analysts, and consultants alike.
- Easy to Use: A straightforward design and guided instructions ensure accessibility for all users.
Who Should Use This Product?
- Finance Students: Explore valuation techniques and apply them using real-world data.
- Academics: Integrate industry-standard models into your curriculum or research projects.
- Investors: Validate your assumptions and assess valuation scenarios for DENSO Corporation (6902T).
- Analysts: Enhance your efficiency with a ready-to-use, customizable DCF model.
- Small Business Owners: Discover the methodologies used to evaluate large public companies like DENSO Corporation (6902T).
Contents of the Template
- Pre-Filled Data: Features DENSO Corporation's historical financials and projections.
- Discounted Cash Flow Model: An editable DCF valuation model with automatic calculations.
- Weighted Average Cost of Capital (WACC): A specialized sheet for computing WACC using custom inputs.
- Key Financial Ratios: Evaluate DENSO Corporation's profitability, efficiency, and leverage.
- Customizable Inputs: Easily modify revenue growth, margins, and tax rates.
- Clear Dashboard: Visual representations and tables summarizing essential valuation results.
Disclaimer
All information, articles, and product details provided on this website are for general informational and educational purposes only. We do not claim any ownership over, nor do we intend to infringe upon, any trademarks, copyrights, logos, brand names, or other intellectual property mentioned or depicted on this site. Such intellectual property remains the property of its respective owners, and any references here are made solely for identification or informational purposes, without implying any affiliation, endorsement, or partnership.
We make no representations or warranties, express or implied, regarding the accuracy, completeness, or suitability of any content or products presented. Nothing on this website should be construed as legal, tax, investment, financial, medical, or other professional advice. In addition, no part of this site—including articles or product references—constitutes a solicitation, recommendation, endorsement, advertisement, or offer to buy or sell any securities, franchises, or other financial instruments, particularly in jurisdictions where such activity would be unlawful.
All content is of a general nature and may not address the specific circumstances of any individual or entity. It is not a substitute for professional advice or services. Any actions you take based on the information provided here are strictly at your own risk. You accept full responsibility for any decisions or outcomes arising from your use of this website and agree to release us from any liability in connection with your use of, or reliance upon, the content or products found herein.