
|
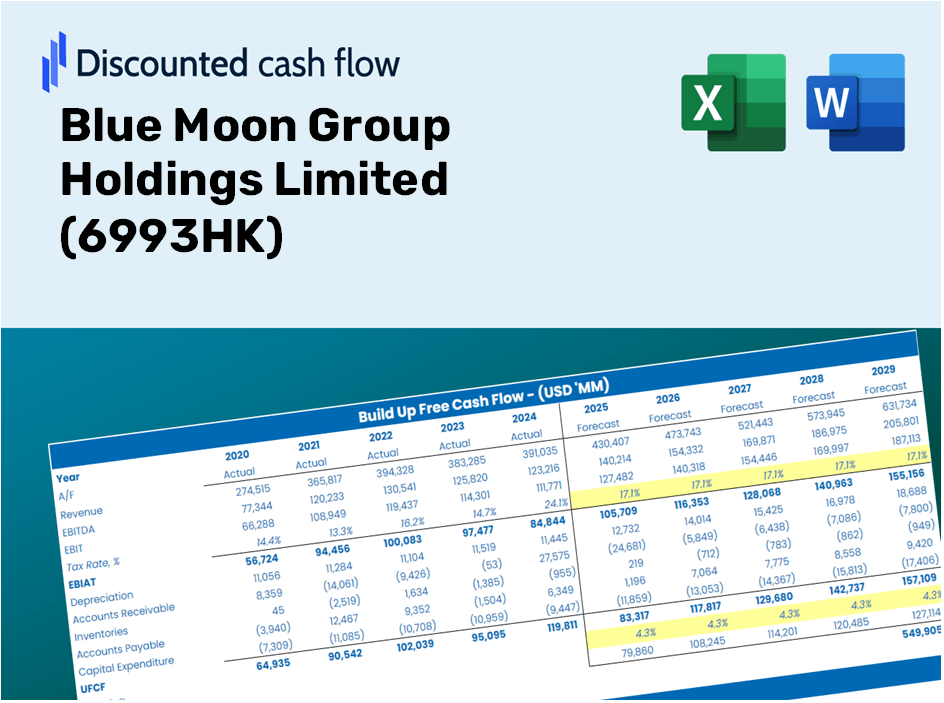
Blue Moon Group Holdings Limited (6993.HK) DCF -Bewertung |
Fully Editable: Tailor To Your Needs In Excel Or Sheets
Professional Design: Trusted, Industry-Standard Templates
Investor-Approved Valuation Models
MAC/PC Compatible, Fully Unlocked
No Expertise Is Needed; Easy To Follow
Blue Moon Group Holdings Limited (6993.HK) Bundle
Vereinfachen Sie mit diesem anpassbaren DCF -Taschenrechner die Blue Moon Group Holdings Limited Bewertung! Mit Real Blue Moon Group Holdings Limited (6993HK) Finanzdaten und einstellbaren Prognoseeingaben können Sie Szenarien testen und Blue Moon Group Holdings Limited (6993HK) in Minuten aufdecken.
Discounted Cash Flow (DCF) - (USD MM)
| Year | AY1 2020 |
AY2 2021 |
AY3 2022 |
AY4 2023 |
AY5 2024 |
FY1 2025 |
FY2 2026 |
FY3 2027 |
FY4 2028 |
FY5 2029 |
|---|---|---|---|---|---|---|---|---|---|---|
| Revenue | 6,996.3 | 7,597.5 | 7,946.7 | 7,323.5 | 8,555.6 | 9,029.8 | 9,530.3 | 10,058.5 | 10,616.0 | 11,204.4 |
| Revenue Growth, % | 0 | 8.59 | 4.6 | -7.84 | 16.82 | 5.54 | 5.54 | 5.54 | 5.54 | 5.54 |
| EBITDA | 1,938.4 | 1,521.5 | 1,100.2 | 656.4 | -545.6 | 1,158.7 | 1,223.0 | 1,290.7 | 1,362.3 | 1,437.8 |
| EBITDA, % | 27.71 | 20.03 | 13.84 | 8.96 | -6.38 | 12.83 | 12.83 | 12.83 | 12.83 | 12.83 |
| Depreciation | 181.5 | 229.8 | 252.5 | 253.8 | 234.8 | 271.0 | 286.0 | 301.8 | 318.6 | 336.2 |
| Depreciation, % | 2.59 | 3.02 | 3.18 | 3.46 | 2.74 | 3 | 3 | 3 | 3 | 3 |
| EBIT | 1,756.9 | 1,291.8 | 847.6 | 402.6 | -780.4 | 887.8 | 937.0 | 988.9 | 1,043.7 | 1,101.6 |
| EBIT, % | 25.11 | 17 | 10.67 | 5.5 | -9.12 | 9.83 | 9.83 | 9.83 | 9.83 | 9.83 |
| Total Cash | 10,921.1 | 9,233.7 | 7,702.4 | 7,331.8 | 5,270.5 | 8,280.8 | 8,739.8 | 9,224.2 | 9,735.5 | 10,275.1 |
| Total Cash, percent | .0 | .0 | .0 | .0 | .0 | .0 | .0 | .0 | .0 | .0 |
| Account Receivables | 2,146.6 | 2,270.8 | 2,148.7 | 1,563.9 | 1,318.7 | 2,246.2 | 2,370.7 | 2,502.1 | 2,640.8 | 2,787.1 |
| Account Receivables, % | 30.68 | 29.89 | 27.04 | 21.35 | 15.41 | 24.88 | 24.88 | 24.88 | 24.88 | 24.88 |
| Inventories | 469.8 | 386.0 | 272.9 | 269.1 | 487.6 | 444.3 | 468.9 | 494.9 | 522.4 | 551.3 |
| Inventories, % | 6.71 | 5.08 | 3.43 | 3.67 | 5.7 | 4.92 | 4.92 | 4.92 | 4.92 | 4.92 |
| Accounts Payable | 548.5 | 662.0 | 481.4 | 578.4 | 660.1 | 690.3 | 728.6 | 769.0 | 811.6 | 856.6 |
| Accounts Payable, % | 7.84 | 8.71 | 6.06 | 7.9 | 7.72 | 7.65 | 7.65 | 7.65 | 7.65 | 7.65 |
| Capital Expenditure | -321.4 | -325.0 | -288.6 | -92.6 | -149.9 | -280.3 | -295.8 | -312.2 | -329.5 | -347.8 |
| Capital Expenditure, % | -4.59 | -4.28 | -3.63 | -1.26 | -1.75 | -3.1 | -3.1 | -3.1 | -3.1 | -3.1 |
| Tax Rate, % | 4.55 | 4.55 | 4.55 | 4.55 | 4.55 | 4.55 | 4.55 | 4.55 | 4.55 | 4.55 |
| EBITAT | 1,314.8 | 1,031.0 | 618.4 | 330.8 | -744.9 | 719.5 | 759.4 | 801.4 | 845.9 | 892.7 |
| Depreciation | ||||||||||
| Changes in Account Receivables | ||||||||||
| Changes in Inventories | ||||||||||
| Changes in Accounts Payable | ||||||||||
| Capital Expenditure | ||||||||||
| UFCF | -892.9 | 1,008.9 | 636.7 | 1,177.6 | -551.5 | -143.9 | 638.7 | 674.1 | 711.4 | 750.9 |
| WACC, % | 5.19 | 5.19 | 5.19 | 5.19 | 5.2 | 5.19 | 5.19 | 5.19 | 5.19 | 5.19 |
| PV UFCF | ||||||||||
| SUM PV UFCF | 2,183.4 | |||||||||
| Long Term Growth Rate, % | 3.00 | |||||||||
| Free cash flow (T + 1) | 773 | |||||||||
| Terminal Value | 35,250 | |||||||||
| Present Terminal Value | 27,366 | |||||||||
| Enterprise Value | 29,549 | |||||||||
| Net Debt | -5,117 | |||||||||
| Equity Value | 34,666 | |||||||||
| Diluted Shares Outstanding, MM | 5,454 | |||||||||
| Equity Value Per Share | 6.36 |
Benefits You Will Receive
- Accurate 6993HK Financial Data: Pre-loaded with Blue Moon Group's historical and projected figures for detailed analysis.
- Customizable Template: Easily adjust key variables such as revenue growth, WACC, and EBITDA percentage.
- Instant Calculations: Watch as Blue Moon Group's intrinsic value updates in real-time with your modifications.
- Professional Valuation Tool: Tailored for investors, analysts, and consultants looking for reliable DCF results.
- User-Friendly Interface: Intuitive layout and straightforward instructions suitable for users of all skill levels.
Key Features
- Comprehensive DCF Calculator: Features both unlevered and levered DCF valuation models tailored for Blue Moon Group Holdings Limited (6993HK).
- WACC Calculator: Includes a customizable Weighted Average Cost of Capital sheet to meet your specific needs.
- Adjustable Forecast Assumptions: Allows you to tweak growth rates, capital expenditures, and discount rates as necessary.
- Integrated Financial Ratios: Evaluate profitability, leverage, and efficiency ratios for Blue Moon Group Holdings Limited (6993HK).
- Interactive Dashboard and Charts: Provides visual representations to summarize key valuation metrics for straightforward analysis.
How It Functions
- Download the Template: Gain immediate access to the Excel-based BMGH DCF Calculator.
- Input Your Assumptions: Modify the yellow-highlighted cells for growth rates, WACC, margins, and other variables.
- Instant Calculations: The model recalculates Blue Moon Group Holdings Limited’s intrinsic value automatically.
- Test Scenarios: Experiment with various assumptions to assess potential valuation impacts.
- Analyze and Decide: Utilize the findings to inform your investment or financial analysis.
Why Opt for This Calculator?
- All-in-One Solution: Combines DCF, WACC, and financial ratio analyses into a single tool.
- Flexible Inputs: Modify the yellow-highlighted fields to explore different scenarios.
- In-Depth Analytics: Automatically computes the intrinsic value and Net Present Value for Blue Moon Group Holdings Limited (6993HK).
- Ready-to-Use Data: Comes with historical and projected data for precise calculations.
- High-Quality Standards: Perfect for financial analysts, investors, and business consultants.
Who Can Benefit from This Product?
- Professional Investors: Create comprehensive and trustworthy valuation models for analyzing portfolios involving Blue Moon Group Holdings Limited (6993HK).
- Corporate Finance Teams: Examine valuation scenarios to inform internal business strategies related to Blue Moon Group Holdings Limited (6993HK).
- Consultants and Advisors: Offer clients precise valuation insights for Blue Moon Group Holdings Limited (6993HK).
- Students and Educators: Leverage real-world data for practicing and teaching financial modeling with a focus on Blue Moon Group Holdings Limited (6993HK).
- Tech Enthusiasts: Gain a deeper understanding of how companies like Blue Moon Group Holdings Limited (6993HK) are assessed in the market.
Contents of the Template
- Detailed DCF Model: An editable template featuring extensive valuation calculations.
- Current Data: Blue Moon Group Holdings Limited’s (6993HK) historical and forecasted financials included for in-depth analysis.
- Adjustable Variables: Modify WACC, growth rates, and tax assumptions to explore different scenarios.
- Financial Statements: Comprehensive annual and quarterly breakdowns for enhanced insights.
- Essential Ratios: Integrated analysis for profitability, efficiency, and leverage metrics.
- Visual Dashboard: Charts and tables designed for clear, actionable insights.
Disclaimer
All information, articles, and product details provided on this website are for general informational and educational purposes only. We do not claim any ownership over, nor do we intend to infringe upon, any trademarks, copyrights, logos, brand names, or other intellectual property mentioned or depicted on this site. Such intellectual property remains the property of its respective owners, and any references here are made solely for identification or informational purposes, without implying any affiliation, endorsement, or partnership.
We make no representations or warranties, express or implied, regarding the accuracy, completeness, or suitability of any content or products presented. Nothing on this website should be construed as legal, tax, investment, financial, medical, or other professional advice. In addition, no part of this site—including articles or product references—constitutes a solicitation, recommendation, endorsement, advertisement, or offer to buy or sell any securities, franchises, or other financial instruments, particularly in jurisdictions where such activity would be unlawful.
All content is of a general nature and may not address the specific circumstances of any individual or entity. It is not a substitute for professional advice or services. Any actions you take based on the information provided here are strictly at your own risk. You accept full responsibility for any decisions or outcomes arising from your use of this website and agree to release us from any liability in connection with your use of, or reliance upon, the content or products found herein.