
|
Mitsubishi Heavy Industries, Ltd. (7011.t) DCF -Bewertung |
Fully Editable: Tailor To Your Needs In Excel Or Sheets
Professional Design: Trusted, Industry-Standard Templates
Investor-Approved Valuation Models
MAC/PC Compatible, Fully Unlocked
No Expertise Is Needed; Easy To Follow
Mitsubishi Heavy Industries, Ltd. (7011.T) Bundle
Vereinfachen Sie Mitsubishi Heavy Industries, Ltd. (7011t) Bewertung mit diesem anpassbaren DCF -Taschenrechner! Mit Real Mitsubishi Heavy Industries, Ltd. (7011t) Finanzdaten und einstellbaren prognostizierten Inputs können Sie Szenarien testen und Mitsubishi Heavy Industries, Ltd. (7011t) faire Wert in Minuten aufdecken.
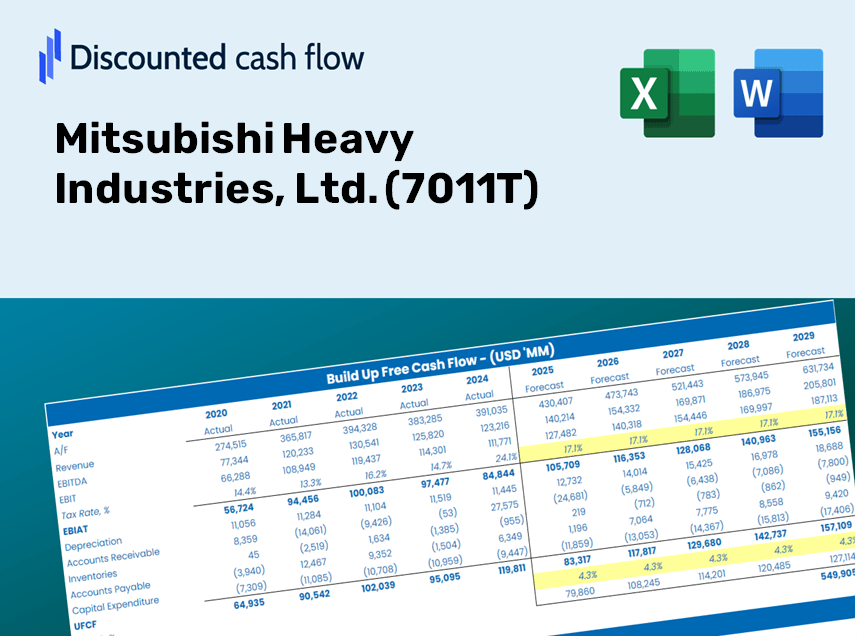
Discounted Cash Flow (DCF) - (USD MM)
| Year | AY1 2021 |
AY2 2022 |
AY3 2023 |
AY4 2024 |
AY5 2025 |
FY1 2026 |
FY2 2027 |
FY3 2028 |
FY4 2029 |
FY5 2030 |
|---|---|---|---|---|---|---|---|---|---|---|
| Revenue | 3,699,946.0 | 3,860,283.0 | 4,202,797.0 | 4,657,147.0 | 5,027,176.0 | 5,428,876.6 | 5,862,675.3 | 6,331,137.2 | 6,837,031.8 | 7,383,350.3 |
| Revenue Growth, % | 0 | 4.33 | 8.87 | 10.81 | 7.95 | 7.99 | 7.99 | 7.99 | 7.99 | 7.99 |
| EBITDA | 284,018.0 | 307,429.0 | 351,719.0 | 482,054.0 | 557,521.0 | 493,483.2 | 532,915.4 | 575,498.4 | 621,484.1 | 671,144.3 |
| EBITDA, % | 7.68 | 7.96 | 8.37 | 10.35 | 11.09 | 9.09 | 9.09 | 9.09 | 9.09 | 9.09 |
| Depreciation | 238,258.0 | 135,787.0 | 148,549.0 | 155,899.0 | 160,643.0 | 217,530.5 | 234,912.5 | 253,683.3 | 273,954.1 | 295,844.6 |
| Depreciation, % | 6.44 | 3.52 | 3.53 | 3.35 | 3.2 | 4.01 | 4.01 | 4.01 | 4.01 | 4.01 |
| EBIT | 45,760.0 | 171,642.0 | 203,170.0 | 326,155.0 | 396,878.0 | 275,952.7 | 298,002.9 | 321,815.1 | 347,530.0 | 375,299.6 |
| EBIT, % | 1.24 | 4.45 | 4.83 | 7 | 7.89 | 5.08 | 5.08 | 5.08 | 5.08 | 5.08 |
| Total Cash | 245,421.0 | 314,257.0 | 347,663.0 | 431,287.0 | 657,816.0 | 492,855.2 | 532,237.2 | 574,766.1 | 620,693.2 | 670,290.2 |
| Total Cash, percent | .0 | .0 | .0 | .0 | .0 | .0 | .0 | .0 | .0 | .0 |
| Account Receivables | 1,234,117.0 | 1,399,438.0 | 1,536,433.0 | 1,692,410.0 | 1,776,555.0 | 1,930,982.9 | 2,085,279.6 | 2,251,905.6 | 2,431,845.9 | 2,626,164.5 |
| Account Receivables, % | 33.36 | 36.25 | 36.56 | 36.34 | 35.34 | 35.57 | 35.57 | 35.57 | 35.57 | 35.57 |
| Inventories | 713,498.0 | 798,601.0 | 876,878.0 | 974,577.0 | 1,062,532.0 | 1,117,241.5 | 1,206,515.6 | 1,302,923.2 | 1,407,034.3 | 1,519,464.5 |
| Inventories, % | 19.28 | 20.69 | 20.86 | 20.93 | 21.14 | 20.58 | 20.58 | 20.58 | 20.58 | 20.58 |
| Accounts Payable | 763,731.0 | 863,281.0 | 895,286.0 | 958,891.0 | 930,281.0 | 1,122,710.0 | 1,212,421.0 | 1,309,300.5 | 1,413,921.2 | 1,526,901.8 |
| Accounts Payable, % | 20.64 | 22.36 | 21.3 | 20.59 | 18.51 | 20.68 | 20.68 | 20.68 | 20.68 | 20.68 |
| Capital Expenditure | -146,212.0 | -129,256.0 | -131,905.0 | -160,486.0 | -240,692.0 | -202,740.6 | -218,940.8 | -236,435.4 | -255,327.9 | -275,730.1 |
| Capital Expenditure, % | -3.95 | -3.35 | -3.14 | -3.45 | -4.79 | -3.73 | -3.73 | -3.73 | -3.73 | -3.73 |
| Tax Rate, % | 34.47 | 34.47 | 34.47 | 34.47 | 34.47 | 34.47 | 34.47 | 34.47 | 34.47 | 34.47 |
| EBITAT | 37,678.9 | 112,206.1 | 138,671.5 | 229,749.0 | 260,093.1 | 194,239.1 | 209,759.9 | 226,521.0 | 244,621.3 | 264,168.0 |
| Depreciation | ||||||||||
| Changes in Account Receivables | ||||||||||
| Changes in Inventories | ||||||||||
| Changes in Accounts Payable | ||||||||||
| Capital Expenditure | ||||||||||
| UFCF | -1,054,159.1 | -32,136.9 | -27,951.5 | 35,091.0 | -20,665.9 | 192,320.6 | 71,871.9 | 77,614.8 | 83,816.7 | 90,514.2 |
| WACC, % | 4.71 | 4.66 | 4.67 | 4.67 | 4.66 | 4.67 | 4.67 | 4.67 | 4.67 | 4.67 |
| PV UFCF | ||||||||||
| SUM PV UFCF | 458,848.8 | |||||||||
| Long Term Growth Rate, % | 3.50 | |||||||||
| Free cash flow (T + 1) | 93,682 | |||||||||
| Terminal Value | 7,975,758 | |||||||||
| Present Terminal Value | 6,346,959 | |||||||||
| Enterprise Value | 6,805,808 | |||||||||
| Net Debt | 473,458 | |||||||||
| Equity Value | 6,332,350 | |||||||||
| Diluted Shares Outstanding, MM | 3,360 | |||||||||
| Equity Value Per Share | 1,884.72 |
What You'll Receive
- Comprehensive Financial Model: Leverage Mitsubishi Heavy Industries' actual data for accurate DCF valuation.
- Complete Forecast Flexibility: Modify revenue growth, profit margins, WACC, and other critical variables as needed.
- Real-Time Calculations: Instantaneous updates let you see the impact of your changes immediately.
- Professional-Grade Template: A polished Excel file crafted for high-quality valuation presentations.
- Adaptable and Reusable: Designed for versatility, making it easy to apply for multiple detailed forecasts.
Key Features
- 🔍 Real-Life MHI Financials: Pre-filled historical and projected data for Mitsubishi Heavy Industries, Ltd. (7011T).
- ✏️ Fully Customizable Inputs: Modify all essential parameters (yellow cells) such as WACC, growth %, and tax rates.
- 📊 Professional DCF Valuation: Integrated formulas compute MHI’s intrinsic value using the Discounted Cash Flow method.
- ⚡ Instant Results: Immediately visualize MHI’s valuation after making adjustments.
- Scenario Analysis: Evaluate and compare different outcomes based on various financial assumptions side-by-side.
How It Works
- Step 1: Download the prebuilt Excel template featuring Mitsubishi Heavy Industries, Ltd.'s data.
- Step 2: Navigate through the pre-filled sheets to grasp essential metrics.
- Step 3: Modify forecasts and assumptions in the editable yellow cells (WACC, growth, margins).
- Step 4: Instantly observe the recalculated results, including the intrinsic value of Mitsubishi Heavy Industries, Ltd. (7011T).
- Step 5: Utilize the outputs to make informed investment decisions or generate reports.
Why Select This Calculator for Mitsubishi Heavy Industries, Ltd. (7011T)?
- Precision: Leverages authentic Mitsubishi financial data for reliable outcomes.
- Adaptability: Crafted to allow users to freely experiment with and adjust inputs.
- Efficiency: Eliminate the complexity of constructing a DCF model from the ground up.
- Expert-Level: Designed with the precision and functionality expected by CFOs.
- Intuitive: Simple to navigate, making it accessible for users without extensive financial modeling skills.
Who Should Consider This Product?
- Investors: Assess Mitsubishi Heavy Industries, Ltd. (7011T)'s valuation before making investment decisions.
- CFOs and Financial Analysts: Optimize valuation processes and validate financial projections.
- Startup Founders: Understand how large public firms like Mitsubishi Heavy Industries, Ltd. (7011T) are appraised.
- Consultants: Create comprehensive valuation reports for their clients.
- Students and Educators: Utilize real-life data to learn and teach valuation methodologies.
Contents of the Template
- Pre-Filled Data: Contains Mitsubishi Heavy Industries' historical financials and projections.
- Discounted Cash Flow Model: An editable DCF valuation model with automatic computations.
- Weighted Average Cost of Capital (WACC): A dedicated section for WACC calculations based on user-defined inputs.
- Key Financial Ratios: Evaluate Mitsubishi Heavy Industries' profitability, efficiency, and financial leverage.
- Customizable Inputs: Easily modify revenue growth, margins, and tax rates.
- Clear Dashboard: Visual representations and tables that summarize essential valuation outcomes.
Disclaimer
All information, articles, and product details provided on this website are for general informational and educational purposes only. We do not claim any ownership over, nor do we intend to infringe upon, any trademarks, copyrights, logos, brand names, or other intellectual property mentioned or depicted on this site. Such intellectual property remains the property of its respective owners, and any references here are made solely for identification or informational purposes, without implying any affiliation, endorsement, or partnership.
We make no representations or warranties, express or implied, regarding the accuracy, completeness, or suitability of any content or products presented. Nothing on this website should be construed as legal, tax, investment, financial, medical, or other professional advice. In addition, no part of this site—including articles or product references—constitutes a solicitation, recommendation, endorsement, advertisement, or offer to buy or sell any securities, franchises, or other financial instruments, particularly in jurisdictions where such activity would be unlawful.
All content is of a general nature and may not address the specific circumstances of any individual or entity. It is not a substitute for professional advice or services. Any actions you take based on the information provided here are strictly at your own risk. You accept full responsibility for any decisions or outcomes arising from your use of this website and agree to release us from any liability in connection with your use of, or reliance upon, the content or products found herein.