
|
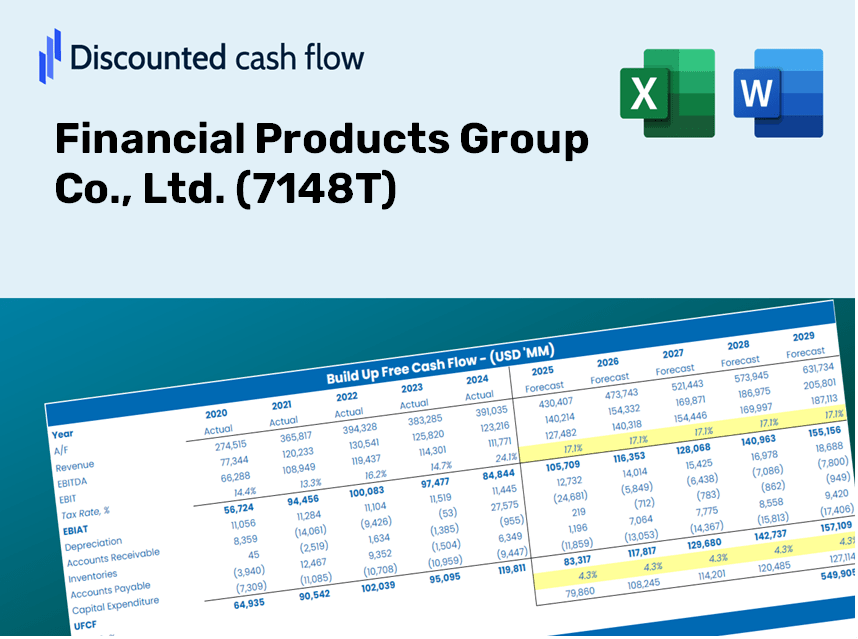
Financial Products Group Co., Ltd. (7148.t) DCF -Bewertung |
Fully Editable: Tailor To Your Needs In Excel Or Sheets
Professional Design: Trusted, Industry-Standard Templates
Investor-Approved Valuation Models
MAC/PC Compatible, Fully Unlocked
No Expertise Is Needed; Easy To Follow
Financial Products Group Co., Ltd. (7148.T) Bundle
Unabhängig davon, ob Sie ein Investor oder Analyst sind, ist dieser (7148T) DCF-Taschenrechner Ihre Anlaufstelle für eine genaue Bewertung. Ausgestattet mit realen Daten der Financial Products Group Co., Ltd. können Sie Prognosen anpassen und die Auswirkungen sofort beobachten.
Discounted Cash Flow (DCF) - (USD MM)
| Year | AY1 2020 |
AY2 2021 |
AY3 2022 |
AY4 2023 |
AY5 2024 |
FY1 2025 |
FY2 2026 |
FY3 2027 |
FY4 2028 |
FY5 2029 |
|---|---|---|---|---|---|---|---|---|---|---|
| Revenue | 12,708.3 | 14,924.1 | 59,193.0 | 71,149.0 | 107,781.0 | 158,740.0 | 233,792.5 | 344,330.0 | 507,129.7 | 746,901.4 |
| Revenue Growth, % | 0 | 17.44 | 296.63 | 20.2 | 51.49 | 47.28 | 47.28 | 47.28 | 47.28 | 47.28 |
| EBITDA | 3,373.0 | 5,842.3 | 13,005.0 | 19,241.0 | 30,647.0 | 45,443.1 | 66,928.7 | 98,572.6 | 145,177.9 | 213,818.3 |
| EBITDA, % | 26.54 | 39.15 | 21.97 | 27.04 | 28.43 | 28.63 | 28.63 | 28.63 | 28.63 | 28.63 |
| Depreciation | 720.0 | 553.5 | 308.0 | 321.0 | 486.0 | 3,427.8 | 5,048.5 | 7,435.4 | 10,950.9 | 16,128.5 |
| Depreciation, % | 5.67 | 3.71 | 0.52033 | 0.45117 | 0.45091 | 2.16 | 2.16 | 2.16 | 2.16 | 2.16 |
| EBIT | 2,653.0 | 5,288.8 | 12,697.0 | 18,920.0 | 30,161.0 | 42,015.3 | 61,880.2 | 91,137.2 | 134,227.0 | 197,689.7 |
| EBIT, % | 20.88 | 35.44 | 21.45 | 26.59 | 27.98 | 26.47 | 26.47 | 26.47 | 26.47 | 26.47 |
| Total Cash | 27,785.0 | 21,286.1 | 13,613.0 | 16,631.0 | 18,452.0 | 83,653.6 | 123,205.1 | 181,456.7 | 267,249.7 | 393,605.8 |
| Total Cash, percent | .0 | .0 | .0 | .0 | .0 | .0 | .0 | .0 | .0 | .0 |
| Account Receivables | 490.5 | 994.0 | 480.0 | 546.0 | 709.0 | 4,049.9 | 5,964.7 | 8,784.8 | 12,938.3 | 19,055.6 |
| Account Receivables, % | 3.86 | 6.66 | 0.81091 | 0.7674 | 0.65782 | 2.55 | 2.55 | 2.55 | 2.55 | 2.55 |
| Inventories | 14,682.0 | 40,111.8 | 112,339.0 | 121,047.0 | 193,595.0 | 158,740.0 | 233,792.5 | 344,330.0 | 507,129.7 | 746,901.4 |
| Inventories, % | 115.53 | 268.77 | 189.78 | 170.13 | 179.62 | 100 | 100 | 100 | 100 | 100 |
| Accounts Payable | 218.4 | 260.0 | 355.0 | 1,074.0 | 699.0 | 1,974.2 | 2,907.7 | 4,282.4 | 6,307.2 | 9,289.2 |
| Accounts Payable, % | 1.72 | 1.74 | 0.59973 | 1.51 | 0.64854 | 1.24 | 1.24 | 1.24 | 1.24 | 1.24 |
| Capital Expenditure | -68.3 | -127.3 | -287.0 | -9,367.0 | -1,006.0 | -5,071.6 | -7,469.4 | -11,001.0 | -16,202.2 | -23,862.7 |
| Capital Expenditure, % | -0.53781 | -0.85309 | -0.48485 | -13.17 | -0.93337 | -3.19 | -3.19 | -3.19 | -3.19 | -3.19 |
| Tax Rate, % | 30.52 | 30.52 | 30.52 | 30.52 | 30.52 | 30.52 | 30.52 | 30.52 | 30.52 | 30.52 |
| EBITAT | 1,777.5 | 3,431.1 | 8,759.9 | 13,208.8 | 20,957.3 | 28,584.4 | 42,099.1 | 62,003.6 | 91,319.0 | 134,494.8 |
| Depreciation | ||||||||||
| Changes in Account Receivables | ||||||||||
| Changes in Inventories | ||||||||||
| Changes in Accounts Payable | ||||||||||
| Capital Expenditure | ||||||||||
| UFCF | -12,525.0 | -22,034.3 | -62,837.3 | -3,892.2 | -52,648.7 | 59,729.9 | -36,355.7 | -53,544.7 | -78,860.8 | -116,146.3 |
| WACC, % | 6.46 | 6.43 | 6.49 | 6.5 | 6.5 | 6.48 | 6.48 | 6.48 | 6.48 | 6.48 |
| PV UFCF | ||||||||||
| SUM PV UFCF | -166,544.8 | |||||||||
| Long Term Growth Rate, % | 2.00 | |||||||||
| Free cash flow (T + 1) | -118,469 | |||||||||
| Terminal Value | -2,646,225 | |||||||||
| Present Terminal Value | -1,933,524 | |||||||||
| Enterprise Value | -2,100,069 | |||||||||
| Net Debt | 132,180 | |||||||||
| Equity Value | -2,232,249 | |||||||||
| Diluted Shares Outstanding, MM | 85 | |||||||||
| Equity Value Per Share | -26,195.65 |
What You Will Receive
- Adjustable Financial Inputs: Seamlessly modify key assumptions (growth %, margins, WACC) to explore various scenarios.
- Comprehensive Data: Financial information for Financial Products Group Co., Ltd. (7148T) pre-filled to enhance your analysis.
- Instant DCF Results: The template automatically computes Net Present Value (NPV) and intrinsic value for you.
- Tailored and Professional: A refined Excel model designed to meet your valuation requirements.
- Designed for Analysts and Investors: Perfect for evaluating projections, confirming strategies, and improving efficiency.
Key Features
- Authentic Financials for Financial Products Group Co., Ltd. (7148T): Gain access to precise pre-loaded historical data and future forecasts.
- Customizable Forecast Parameters: Modify highlighted cells including WACC, growth rates, and profit margins.
- Real-Time Calculations: Automatic adjustments to DCF, Net Present Value (NPV), and cash flow assessments.
- Insightful Visual Dashboard: User-friendly charts and summaries to help you visualize your valuation outcomes.
- Designed for All Skill Levels: An intuitive layout tailored for investors, CFOs, and consultants alike.
How It Works
- Step 1: Download the prebuilt Excel template featuring Financial Products Group Co., Ltd. (7148T) data.
- Step 2: Navigate through the pre-filled sheets to familiarize yourself with the essential metrics.
- Step 3: Modify forecasts and assumptions in the editable yellow cells (WACC, growth, margins).
- Step 4: Instantly see the updated results, including the intrinsic value of Financial Products Group Co., Ltd. (7148T).
- Step 5: Use the outputs to make well-informed investment decisions or generate comprehensive reports.
Why Opt for [Symbol] Calculator?
- Time Efficiency: Skip the hassle of building a DCF model from the ground up – it's ready to go.
- Enhanced Precision: Dependable financial data and formulas minimize errors in valuation.
- Completely Customizable: Adjust the model to align with your specific assumptions and forecasts.
- Simple to Understand: Intuitive charts and outputs facilitate easy analysis of results.
- Recommended by Professionals: Crafted for experts who prioritize accuracy and usability.
Who Can Benefit from This Product?
- Investors: Accurately assess the fair value of Financial Products Group Co., Ltd. (7148T) before making investment choices.
- CFOs: Utilize a high-quality DCF model for comprehensive financial reporting and analysis.
- Consultants: Seamlessly modify the template for client valuation reports.
- Entrepreneurs: Acquire knowledge of financial modeling practices employed by leading corporations.
- Educators: Employ it as a resource to illustrate various valuation methodologies.
Contents of the Template
- Pre-Filled Data: Contains historical financials and projections for Financial Products Group Co., Ltd. (7148T).
- Discounted Cash Flow Model: An editable DCF valuation model featuring automatic calculations.
- Weighted Average Cost of Capital (WACC): A dedicated sheet designed for calculating WACC with user-specific inputs.
- Key Financial Ratios: Evaluate the profitability, efficiency, and leverage of Financial Products Group Co., Ltd. (7148T).
- Customizable Inputs: Easily modify revenue growth, margins, and tax rates.
- Clear Dashboard: Visual representations and tables that summarize essential valuation outcomes.
Disclaimer
All information, articles, and product details provided on this website are for general informational and educational purposes only. We do not claim any ownership over, nor do we intend to infringe upon, any trademarks, copyrights, logos, brand names, or other intellectual property mentioned or depicted on this site. Such intellectual property remains the property of its respective owners, and any references here are made solely for identification or informational purposes, without implying any affiliation, endorsement, or partnership.
We make no representations or warranties, express or implied, regarding the accuracy, completeness, or suitability of any content or products presented. Nothing on this website should be construed as legal, tax, investment, financial, medical, or other professional advice. In addition, no part of this site—including articles or product references—constitutes a solicitation, recommendation, endorsement, advertisement, or offer to buy or sell any securities, franchises, or other financial instruments, particularly in jurisdictions where such activity would be unlawful.
All content is of a general nature and may not address the specific circumstances of any individual or entity. It is not a substitute for professional advice or services. Any actions you take based on the information provided here are strictly at your own risk. You accept full responsibility for any decisions or outcomes arising from your use of this website and agree to release us from any liability in connection with your use of, or reliance upon, the content or products found herein.