
|
Musashi Seimitsu Industry Co., Ltd. (7220.T) DCF -Bewertung |
Fully Editable: Tailor To Your Needs In Excel Or Sheets
Professional Design: Trusted, Industry-Standard Templates
Investor-Approved Valuation Models
MAC/PC Compatible, Fully Unlocked
No Expertise Is Needed; Easy To Follow
Musashi Seimitsu Industry Co., Ltd. (7220.T) Bundle
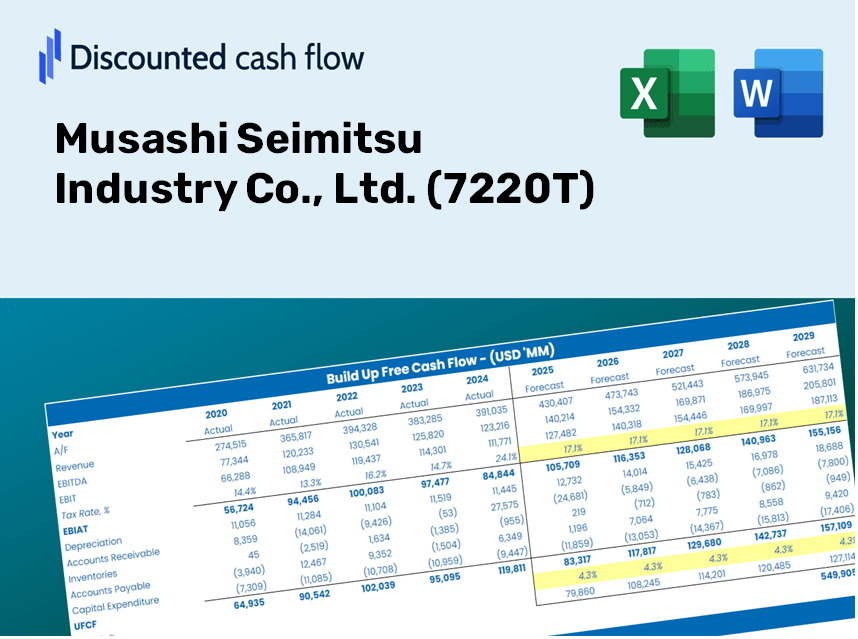
Gewinnen Sie Einblicke in Ihre Musashi Seimitsu Industry Co., Ltd. (7220T) Bewertungsanalyse mit unserem ausgefeilten DCF -Taschenrechner! Diese Excel -Vorlage wird mit tatsächlichen (7220T) Daten vorinstalliert, sodass Sie die Prognosen und Annahmen anpassen können, um die intrinsische Wert von Musashi Seimitsu Industry Co., Ltd. genau zu bestimmen.
Discounted Cash Flow (DCF) - (USD MM)
| Year | AY1 2020 |
AY2 2021 |
AY3 2022 |
AY4 2023 |
AY5 2024 |
FY1 2025 |
FY2 2026 |
FY3 2027 |
FY4 2028 |
FY5 2029 |
|---|---|---|---|---|---|---|---|---|---|---|
| Revenue | 204,714.0 | 241,896.0 | 301,500.0 | 349,917.0 | 347,196.0 | 397,612.6 | 455,350.3 | 521,472.1 | 597,195.5 | 683,914.7 |
| Revenue Growth, % | 0 | 18.16 | 24.64 | 16.06 | -0.77761 | 14.52 | 14.52 | 14.52 | 14.52 | 14.52 |
| EBITDA | 26,506.0 | 26,324.0 | 27,279.0 | 36,348.0 | 36,637.0 | 42,797.3 | 49,011.9 | 56,129.0 | 64,279.5 | 73,613.6 |
| EBITDA, % | 12.95 | 10.88 | 9.05 | 10.39 | 10.55 | 10.76 | 10.76 | 10.76 | 10.76 | 10.76 |
| Depreciation | 16,219.0 | 16,964.0 | 18,908.0 | 19,826.0 | 18,921.0 | 25,703.7 | 29,436.2 | 33,710.6 | 38,605.8 | 44,211.8 |
| Depreciation, % | 7.92 | 7.01 | 6.27 | 5.67 | 5.45 | 6.46 | 6.46 | 6.46 | 6.46 | 6.46 |
| EBIT | 10,287.0 | 9,360.0 | 8,371.0 | 16,522.0 | 17,716.0 | 17,093.5 | 19,575.7 | 22,418.3 | 25,673.7 | 29,401.8 |
| EBIT, % | 5.03 | 3.87 | 2.78 | 4.72 | 5.1 | 4.3 | 4.3 | 4.3 | 4.3 | 4.3 |
| Total Cash | 24,143.0 | 27,554.0 | 26,109.0 | 26,698.0 | 33,849.0 | 39,143.5 | 44,827.5 | 51,337.0 | 58,791.7 | 67,328.8 |
| Total Cash, percent | .0 | .0 | .0 | .0 | .0 | .0 | .0 | .0 | .0 | .0 |
| Account Receivables | 33,674.0 | 39,105.0 | 46,178.0 | 48,912.0 | 50,411.0 | 60,778.3 | 69,604.0 | 79,711.2 | 91,286.2 | 104,541.9 |
| Account Receivables, % | 16.45 | 16.17 | 15.32 | 13.98 | 14.52 | 15.29 | 15.29 | 15.29 | 15.29 | 15.29 |
| Inventories | 37,803.0 | 46,944.0 | 50,259.0 | 55,430.0 | 53,595.0 | 68,246.2 | 78,156.3 | 89,505.5 | 102,502.6 | 117,387.1 |
| Inventories, % | 18.47 | 19.41 | 16.67 | 15.84 | 15.44 | 17.16 | 17.16 | 17.16 | 17.16 | 17.16 |
| Accounts Payable | 17,843.0 | 18,508.0 | 22,528.0 | 24,309.0 | 22,342.0 | 29,599.3 | 33,897.5 | 38,819.8 | 44,456.8 | 50,912.4 |
| Accounts Payable, % | 8.72 | 7.65 | 7.47 | 6.95 | 6.43 | 7.44 | 7.44 | 7.44 | 7.44 | 7.44 |
| Capital Expenditure | -12,845.0 | -17,793.0 | -15,162.0 | -12,992.0 | -15,055.0 | -21,239.0 | -24,323.1 | -27,855.1 | -31,900.0 | -36,532.2 |
| Capital Expenditure, % | -6.27 | -7.36 | -5.03 | -3.71 | -4.34 | -5.34 | -5.34 | -5.34 | -5.34 | -5.34 |
| Tax Rate, % | 49.29 | 49.29 | 49.29 | 49.29 | 49.29 | 49.29 | 49.29 | 49.29 | 49.29 | 49.29 |
| EBITAT | 7,789.2 | 5,832.8 | 2,915.6 | 9,542.9 | 8,983.8 | 9,618.0 | 11,014.6 | 12,614.0 | 14,445.7 | 16,543.4 |
| Depreciation | ||||||||||
| Changes in Account Receivables | ||||||||||
| Changes in Inventories | ||||||||||
| Changes in Accounts Payable | ||||||||||
| Capital Expenditure | ||||||||||
| UFCF | -42,470.8 | -8,903.2 | 293.6 | 10,252.9 | 11,218.8 | -3,678.5 | 1,690.0 | 1,935.5 | 2,216.5 | 2,538.4 |
| WACC, % | 6.53 | 6.38 | 6.05 | 6.32 | 6.24 | 6.3 | 6.3 | 6.3 | 6.3 | 6.3 |
| PV UFCF | ||||||||||
| SUM PV UFCF | 3,251.7 | |||||||||
| Long Term Growth Rate, % | 3.30 | |||||||||
| Free cash flow (T + 1) | 2,622 | |||||||||
| Terminal Value | 87,272 | |||||||||
| Present Terminal Value | 64,286 | |||||||||
| Enterprise Value | 67,538 | |||||||||
| Net Debt | 62,939 | |||||||||
| Equity Value | 4,599 | |||||||||
| Diluted Shares Outstanding, MM | 66 | |||||||||
| Equity Value Per Share | 70.19 |
What You Will Receive
- Pre-Filled Financial Model: Leverage Musashi Seimitsu's actual data for accurate DCF valuation.
- Comprehensive Forecast Control: Modify key parameters like revenue growth, margins, WACC, and more.
- Real-Time Calculations: Enjoy automatic updates that reflect changes instantly.
- Professional-Grade Template: An expertly crafted Excel model ready for investor presentations.
- Customizable and Reusable: Designed for versatility, enabling repeated use for in-depth forecasts.
Key Features
- Customizable Forecast Inputs: Adjust essential factors such as revenue growth, EBITDA %, and capital investments.
- Instant DCF Valuation: Provides quick calculations of intrinsic value, NPV, and additional metrics.
- Industry-Leading Accuracy: Relies on Musashi Seimitsu's actual financial data for precise valuation results.
- Simplified Scenario Analysis: Evaluate various assumptions and easily compare different outcomes.
- Efficient Valuation Tool: Streamlines the process, removing the need to create intricate valuation models from the ground up.
How It Works
- Step 1: Download the prebuilt Excel template featuring Musashi Seimitsu Industry Co., Ltd.'s (7220T) data.
- Step 2: Navigate through the pre-filled sheets to familiarize yourself with the essential metrics.
- Step 3: Modify forecasts and assumptions in the editable yellow cells (WACC, growth, margins) as needed.
- Step 4: Instantly view the updated results, including the intrinsic value of Musashi Seimitsu Industry Co., Ltd. (7220T).
- Step 5: Use the outputs to make informed investment decisions or create detailed reports.
Why Choose Musashi Seimitsu Industry Co., Ltd. (7220T)?
- Efficiency Boost: No need to start from scratch – our solutions are instantly usable.
- Enhanced Precision: Trustworthy financial insights and calculations minimize valuation errors.
- Fully Adjustable: Customize our tools to align with your unique assumptions and forecasts.
- User-Friendly: Intuitive charts and outputs simplify the analysis of results.
- Endorsed by Professionals: Crafted for experts who prioritize accuracy and practical application.
Who Can Benefit from This Product?
- Investors: Evaluate Musashi Seimitsu Industry's valuation before making investment decisions.
- CFOs and Financial Analysts: Optimize valuation workflows and assess future projections.
- Startup Founders: Understand the valuation methods used for established companies like Musashi Seimitsu Industry.
- Consultants: Provide comprehensive valuation reports to your clients.
- Students and Educators: Utilize real-time data to learn and teach valuation methodologies.
Components of the Template
- Operating and Balance Sheet Data: Pre-filled historical data and projections for Musashi Seimitsu Industry Co., Ltd. (7220T), including key metrics such as revenue, EBITDA, EBIT, and capital expenditures.
- WACC Calculation: A dedicated sheet for the Weighted Average Cost of Capital (WACC), featuring essential parameters like Beta, risk-free rate, and share price.
- DCF Valuation (Unlevered and Levered): Customizable Discounted Cash Flow models that display intrinsic value along with comprehensive calculations.
- Financial Statements: Pre-loaded financial statements (annual and quarterly) to facilitate thorough analysis.
- Key Ratios: Includes profitability, leverage, and efficiency ratios specific to Musashi Seimitsu Industry Co., Ltd. (7220T).
- Dashboard and Charts: Visual representation of valuation results and assumptions for straightforward analysis.
Disclaimer
All information, articles, and product details provided on this website are for general informational and educational purposes only. We do not claim any ownership over, nor do we intend to infringe upon, any trademarks, copyrights, logos, brand names, or other intellectual property mentioned or depicted on this site. Such intellectual property remains the property of its respective owners, and any references here are made solely for identification or informational purposes, without implying any affiliation, endorsement, or partnership.
We make no representations or warranties, express or implied, regarding the accuracy, completeness, or suitability of any content or products presented. Nothing on this website should be construed as legal, tax, investment, financial, medical, or other professional advice. In addition, no part of this site—including articles or product references—constitutes a solicitation, recommendation, endorsement, advertisement, or offer to buy or sell any securities, franchises, or other financial instruments, particularly in jurisdictions where such activity would be unlawful.
All content is of a general nature and may not address the specific circumstances of any individual or entity. It is not a substitute for professional advice or services. Any actions you take based on the information provided here are strictly at your own risk. You accept full responsibility for any decisions or outcomes arising from your use of this website and agree to release us from any liability in connection with your use of, or reliance upon, the content or products found herein.