
|
Nok Corporation (7240.T) DCF -Bewertung |
Fully Editable: Tailor To Your Needs In Excel Or Sheets
Professional Design: Trusted, Industry-Standard Templates
Investor-Approved Valuation Models
MAC/PC Compatible, Fully Unlocked
No Expertise Is Needed; Easy To Follow
NOK Corporation (7240.T) Bundle
Bewerten Sie die finanziellen Aussichten der NOK Corporation wie ein Experte! Dieser (7240T) DCF-Taschenrechner bietet vorgefüllte Finanzdaten und vollständige Flexibilität, um das Umsatzwachstum, WACC, Margen und andere wichtige Annahmen zu ändern, um sich an Ihren Projektionen anzupassen.
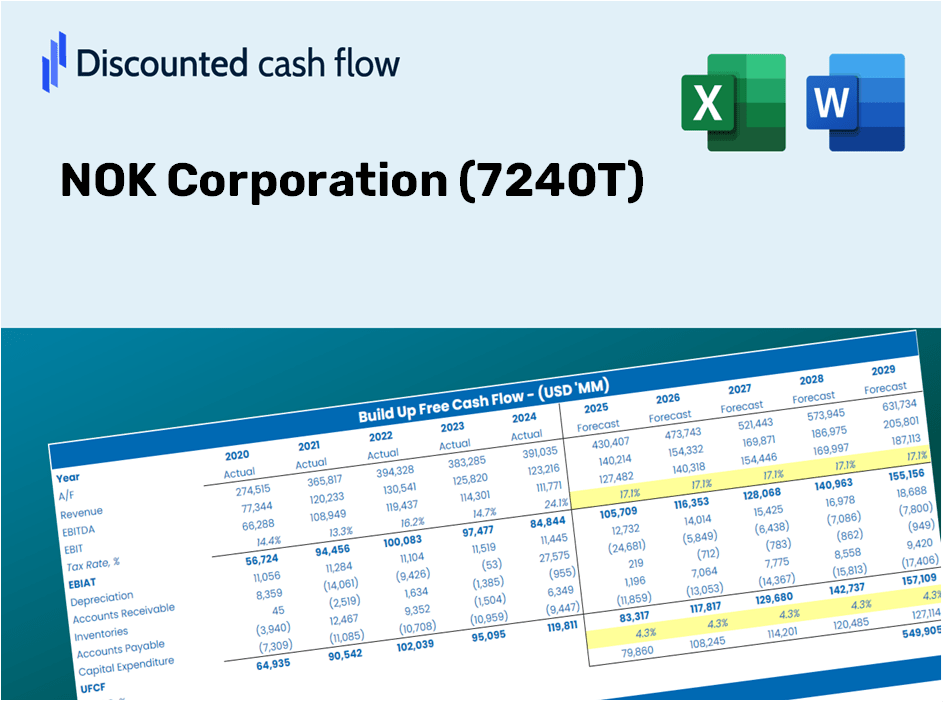
Discounted Cash Flow (DCF) - (USD MM)
| Year | AY1 2020 |
AY2 2021 |
AY3 2022 |
AY4 2023 |
AY5 2024 |
FY1 2025 |
FY2 2026 |
FY3 2027 |
FY4 2028 |
FY5 2029 |
|---|---|---|---|---|---|---|---|---|---|---|
| Revenue | 596,369.0 | 682,507.0 | 709,956.0 | 750,502.0 | 766,859.0 | 817,387.5 | 871,245.3 | 928,651.7 | 989,840.8 | 1,055,061.5 |
| Revenue Growth, % | 0 | 14.44 | 4.02 | 5.71 | 2.18 | 6.59 | 6.59 | 6.59 | 6.59 | 6.59 |
| EBITDA | 50,805.0 | 89,590.0 | 76,586.0 | 106,064.0 | 100,212.0 | 97,487.1 | 103,910.5 | 110,757.2 | 118,055.0 | 125,833.7 |
| EBITDA, % | 8.52 | 13.13 | 10.79 | 14.13 | 13.07 | 11.93 | 11.93 | 11.93 | 11.93 | 11.93 |
| Depreciation | 40,664.0 | 42,591.0 | 46,044.0 | 48,071.0 | 46,943.0 | 52,429.0 | 55,883.6 | 59,565.7 | 63,490.5 | 67,673.9 |
| Depreciation, % | 6.82 | 6.24 | 6.49 | 6.41 | 6.12 | 6.41 | 6.41 | 6.41 | 6.41 | 6.41 |
| EBIT | 10,141.0 | 46,999.0 | 30,542.0 | 57,993.0 | 53,269.0 | 45,058.1 | 48,027.0 | 51,191.5 | 54,564.5 | 58,159.8 |
| EBIT, % | 1.7 | 6.89 | 4.3 | 7.73 | 6.95 | 5.51 | 5.51 | 5.51 | 5.51 | 5.51 |
| Total Cash | 120,421.0 | 113,085.0 | 104,690.0 | 136,913.0 | 136,762.0 | 143,180.6 | 152,614.8 | 162,670.7 | 173,389.0 | 184,813.7 |
| Total Cash, percent | .0 | .0 | .0 | .0 | .0 | .0 | .0 | .0 | .0 | .0 |
| Account Receivables | 151,527.0 | 169,372.0 | 160,794.0 | 154,313.0 | 162,649.0 | 187,417.0 | 199,766.0 | 212,928.6 | 226,958.5 | 241,912.8 |
| Account Receivables, % | 25.41 | 24.82 | 22.65 | 20.56 | 21.21 | 22.93 | 22.93 | 22.93 | 22.93 | 22.93 |
| Inventories | 83,679.0 | 111,260.0 | 119,596.0 | 114,766.0 | 106,074.0 | 124,737.9 | 132,956.9 | 141,717.4 | 151,055.2 | 161,008.3 |
| Inventories, % | 14.03 | 16.3 | 16.85 | 15.29 | 13.83 | 15.26 | 15.26 | 15.26 | 15.26 | 15.26 |
| Accounts Payable | 48,968.0 | 62,568.0 | 52,839.0 | 68,548.0 | 61,028.0 | 68,518.0 | 73,032.6 | 77,844.7 | 82,973.9 | 88,441.1 |
| Accounts Payable, % | 8.21 | 9.17 | 7.44 | 9.13 | 7.96 | 8.38 | 8.38 | 8.38 | 8.38 | 8.38 |
| Capital Expenditure | -23,127.0 | -39,376.0 | -45,429.0 | -46,346.0 | -47,753.0 | -46,507.0 | -49,571.3 | -52,837.6 | -56,319.1 | -60,030.0 |
| Capital Expenditure, % | -3.88 | -5.77 | -6.4 | -6.18 | -6.23 | -5.69 | -5.69 | -5.69 | -5.69 | -5.69 |
| Tax Rate, % | 39.49 | 39.49 | 39.49 | 39.49 | 39.49 | 39.49 | 39.49 | 39.49 | 39.49 | 39.49 |
| EBITAT | -1,726.5 | 26,817.0 | 14,666.0 | 33,510.0 | 32,235.3 | 20,129.7 | 21,456.0 | 22,869.8 | 24,376.6 | 25,982.8 |
| Depreciation | ||||||||||
| Changes in Account Receivables | ||||||||||
| Changes in Inventories | ||||||||||
| Changes in Accounts Payable | ||||||||||
| Capital Expenditure | ||||||||||
| UFCF | -170,427.5 | -1,794.0 | 5,794.0 | 62,255.0 | 24,261.3 | -9,890.3 | 11,715.0 | 12,486.9 | 13,309.6 | 14,186.6 |
| WACC, % | 4.68 | 5.05 | 4.99 | 5.06 | 5.07 | 4.97 | 4.97 | 4.97 | 4.97 | 4.97 |
| PV UFCF | ||||||||||
| SUM PV UFCF | 34,098.4 | |||||||||
| Long Term Growth Rate, % | 3.50 | |||||||||
| Free cash flow (T + 1) | 14,683 | |||||||||
| Terminal Value | 998,252 | |||||||||
| Present Terminal Value | 783,242 | |||||||||
| Enterprise Value | 817,341 | |||||||||
| Net Debt | -75,072 | |||||||||
| Equity Value | 892,413 | |||||||||
| Diluted Shares Outstanding, MM | 164 | |||||||||
| Equity Value Per Share | 5,439.38 |
Benefits You Will Receive
- Customizable Excel Template: A fully adjustable Excel-based DCF Calculator featuring pre-filled real NOK Corporation (7240T) financial data.
- Authentic Data: Access to historical data and forward-looking estimates (highlighted in the yellow cells).
- Flexible Forecasting: Modify key assumptions such as revenue growth, EBITDA percentage, and WACC.
- Instant Calculations: Quickly observe how your inputs affect the valuation of NOK Corporation (7240T).
- Professional Resource: Designed for investors, CFOs, consultants, and financial analysts.
- User-Centric Design: Organized for clarity and simplicity, complete with step-by-step guidance.
Key Features
- 🔍 Real-Life NOK Financials: Pre-filled historical and projected data for NOK Corporation (7240T).
- ✏️ Fully Customizable Inputs: Modify all essential parameters (yellow cells) such as WACC, growth %, and tax rates.
- 📊 Professional DCF Valuation: Integrated formulas compute NOK's intrinsic value using the Discounted Cash Flow method.
- ⚡ Instant Results: Access an immediate visualization of NOK's valuation after adjustments.
- Scenario Analysis: Experiment with and compare outcomes for different financial assumptions side-by-side.
How It Operates
- Step 1: Download the Excel spreadsheet.
- Step 2: Examine NOK Corporation's pre-filled financial information and projections.
- Step 3: Adjust key inputs such as revenue growth, WACC, and tax rates (highlighted fields).
- Step 4: Observe the DCF model refresh in real-time as you modify your assumptions.
- Step 5: Review the results and leverage the findings for your investment strategies.
Why Opt for This Calculator?
- All-in-One Solution: Features DCF, WACC, and financial ratio analyses all in a single tool.
- Flexible Inputs: Modify the yellow-highlighted cells to explore different scenarios.
- In-Depth Analysis: Automatically determines NOK Corporation’s intrinsic value and Net Present Value.
- Preloaded Information: Access historical and projected data for precise starting points.
- High Professional Standards: Perfect for financial analysts, investors, and business consultants.
Who Should Utilize NOK Corporation's (7240T) Products?
- Professional Investors: Develop comprehensive and trustworthy valuation models for portfolio evaluation.
- Corporate Finance Teams: Assess valuation scenarios to inform strategic decisions within the organization.
- Consultants and Advisors: Deliver precise valuation insights to clients regarding NOK Corporation (7240T).
- Students and Educators: Leverage real-world data to enhance practical skills and teach financial modeling.
- Tech Aficionados: Gain insights into how companies like NOK Corporation (7240T) are appraised in the marketplace.
Contents of the Template
- Thorough DCF Model: Fully editable template featuring in-depth valuation calculations.
- Historical Data: NOK Corporation’s (7240T) past and forecasted financials integrated for evaluation.
- Adjustable Parameters: Modify WACC, growth assumptions, and tax rates to explore different scenarios.
- Comprehensive Financial Statements: Complete annual and quarterly reports for enhanced understanding.
- Essential Ratios: In-built analysis focusing on profitability, efficiency, and financial leverage.
- Visual Dashboard: Charts and tables presenting clear, actionable insights.
Disclaimer
All information, articles, and product details provided on this website are for general informational and educational purposes only. We do not claim any ownership over, nor do we intend to infringe upon, any trademarks, copyrights, logos, brand names, or other intellectual property mentioned or depicted on this site. Such intellectual property remains the property of its respective owners, and any references here are made solely for identification or informational purposes, without implying any affiliation, endorsement, or partnership.
We make no representations or warranties, express or implied, regarding the accuracy, completeness, or suitability of any content or products presented. Nothing on this website should be construed as legal, tax, investment, financial, medical, or other professional advice. In addition, no part of this site—including articles or product references—constitutes a solicitation, recommendation, endorsement, advertisement, or offer to buy or sell any securities, franchises, or other financial instruments, particularly in jurisdictions where such activity would be unlawful.
All content is of a general nature and may not address the specific circumstances of any individual or entity. It is not a substitute for professional advice or services. Any actions you take based on the information provided here are strictly at your own risk. You accept full responsibility for any decisions or outcomes arising from your use of this website and agree to release us from any liability in connection with your use of, or reliance upon, the content or products found herein.