
|
Suzuki Motor Corporation (7269.t) DCF -Bewertung |
Fully Editable: Tailor To Your Needs In Excel Or Sheets
Professional Design: Trusted, Industry-Standard Templates
Investor-Approved Valuation Models
MAC/PC Compatible, Fully Unlocked
No Expertise Is Needed; Easy To Follow
Suzuki Motor Corporation (7269.T) Bundle
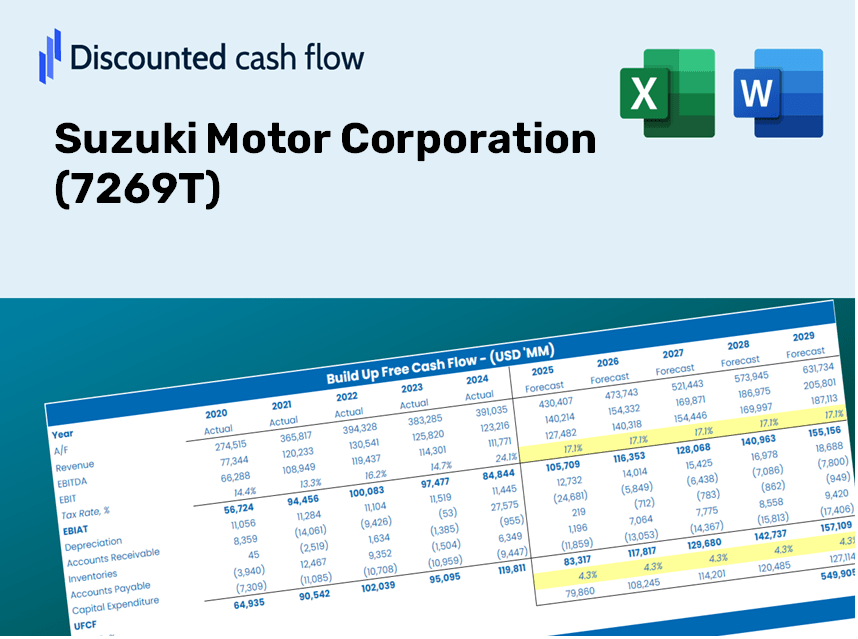
Verbessern Sie Ihre Investitionsauswahl mit dem DCF -Taschenrechner der Suzuki Motor Corporation (7269T)! Verwenden Sie die tatsächlichen Suzuki -Finanzdaten, passen Sie Wachstumsprognosen und -kosten an und beobachten Sie sofort, wie sich diese Modifikationen auf den inneren Wert der Suzuki Motor Corporation (7269T) auswirken.
Discounted Cash Flow (DCF) - (USD MM)
| Year | AY1 2021 |
AY2 2022 |
AY3 2023 |
AY4 2024 |
AY5 2025 |
FY1 2026 |
FY2 2027 |
FY3 2028 |
FY4 2029 |
FY5 2030 |
|---|---|---|---|---|---|---|---|---|---|---|
| Revenue | 3,178,209.0 | 3,568,380.0 | 4,641,644.0 | 5,374,255.0 | 5,825,161.0 | 6,793,988.1 | 7,923,948.2 | 9,241,840.5 | 10,778,921.7 | 12,571,646.6 |
| Revenue Growth, % | 0 | 12.28 | 30.08 | 15.78 | 8.39 | 16.63 | 16.63 | 16.63 | 16.63 | 16.63 |
| EBITDA | 382,544.0 | 441,737.0 | 565,059.0 | 696,548.0 | 1,023,516.0 | 912,035.6 | 1,063,723.2 | 1,240,639.2 | 1,446,979.3 | 1,687,637.5 |
| EBITDA, % | 12.04 | 12.38 | 12.17 | 12.96 | 17.57 | 13.42 | 13.42 | 13.42 | 13.42 | 13.42 |
| Depreciation | 136,545.0 | 161,505.0 | 177,282.0 | 197,215.0 | 249,856.0 | 279,919.8 | 326,475.4 | 380,774.0 | 444,103.4 | 517,965.7 |
| Depreciation, % | 4.3 | 4.53 | 3.82 | 3.67 | 4.29 | 4.12 | 4.12 | 4.12 | 4.12 | 4.12 |
| EBIT | 245,999.0 | 280,232.0 | 387,777.0 | 499,333.0 | 773,660.0 | 632,115.8 | 737,247.8 | 859,865.2 | 1,002,875.9 | 1,169,671.9 |
| EBIT, % | 7.74 | 7.85 | 8.35 | 9.29 | 13.28 | 9.3 | 9.3 | 9.3 | 9.3 | 9.3 |
| Total Cash | 1,226,102.0 | 1,086,629.0 | 1,003,849.0 | 840,020.0 | 842,710.0 | 1,640,805.0 | 1,913,699.8 | 2,231,981.8 | 2,603,199.8 | 3,036,157.8 |
| Total Cash, percent | .0 | .0 | .0 | .0 | .0 | .0 | .0 | .0 | .0 | .0 |
| Account Receivables | 444,463.0 | 427,215.0 | 483,908.0 | 595,754.0 | 598,051.0 | 784,492.5 | 914,967.4 | 1,067,142.7 | 1,244,627.3 | 1,451,630.8 |
| Account Receivables, % | 13.98 | 11.97 | 10.43 | 11.09 | 10.27 | 11.55 | 11.55 | 11.55 | 11.55 | 11.55 |
| Inventories | 355,910.0 | 369,448.0 | 485,313.0 | 573,828.0 | 571,468.0 | 713,302.7 | 831,937.6 | 970,303.5 | 1,131,682.1 | 1,319,900.8 |
| Inventories, % | 11.2 | 10.35 | 10.46 | 10.68 | 9.81 | 10.5 | 10.5 | 10.5 | 10.5 | 10.5 |
| Accounts Payable | 409,185.0 | 302,635.0 | 383,155.0 | 433,101.0 | 412,182.0 | 607,996.0 | 709,116.5 | 827,055.1 | 964,608.9 | 1,125,040.4 |
| Accounts Payable, % | 12.87 | 8.48 | 8.25 | 8.06 | 7.08 | 8.95 | 8.95 | 8.95 | 8.95 | 8.95 |
| Capital Expenditure | -171,706.0 | -190,472.0 | -258,280.0 | -317,118.0 | -344,687.0 | -382,130.3 | -445,685.3 | -519,810.7 | -606,264.3 | -707,096.8 |
| Capital Expenditure, % | -5.4 | -5.34 | -5.56 | -5.9 | -5.92 | -5.62 | -5.62 | -5.62 | -5.62 | -5.62 |
| Tax Rate, % | 43.02 | 43.02 | 43.02 | 43.02 | 43.02 | 43.02 | 43.02 | 43.02 | 43.02 | 43.02 |
| EBITAT | 149,418.5 | 163,825.8 | 225,018.7 | 273,219.9 | 440,800.4 | 365,263.1 | 426,012.8 | 496,866.3 | 579,503.9 | 675,885.6 |
| Depreciation | ||||||||||
| Changes in Account Receivables | ||||||||||
| Changes in Inventories | ||||||||||
| Changes in Accounts Payable | ||||||||||
| Capital Expenditure | ||||||||||
| UFCF | -276,930.5 | 32,018.8 | 51,982.7 | 2,901.9 | 325,113.4 | 130,590.4 | 158,813.6 | 185,227.1 | 216,033.6 | 251,963.8 |
| WACC, % | 5.55 | 5.53 | 5.53 | 5.5 | 5.52 | 5.53 | 5.53 | 5.53 | 5.53 | 5.53 |
| PV UFCF | ||||||||||
| SUM PV UFCF | 790,756.1 | |||||||||
| Long Term Growth Rate, % | 2.00 | |||||||||
| Free cash flow (T + 1) | 257,003 | |||||||||
| Terminal Value | 7,288,794 | |||||||||
| Present Terminal Value | 5,570,039 | |||||||||
| Enterprise Value | 6,360,795 | |||||||||
| Net Debt | -49,872 | |||||||||
| Equity Value | 6,410,667 | |||||||||
| Diluted Shares Outstanding, MM | 1,929 | |||||||||
| Equity Value Per Share | 3,322.82 |
What You Will Receive
- Authentic SUZUKI Financial Data: Access to historical and projected metrics for precise valuation.
- Customizable Parameters: Adjust inputs such as WACC, tax rates, revenue growth, and capital expenditures.
- Automated Calculations: Real-time computation of intrinsic value and NPV.
- Scenario Evaluation: Analyze various scenarios to assess Suzuki’s future performance.
- User-Friendly Design: Designed for industry experts but also easy for beginners to navigate.
Key Features
- Pre-Loaded Data: Suzuki Motor Corporation's historical financial statements and pre-filled forecasts.
- Fully Adjustable Inputs: Modify WACC, tax rates, revenue growth, and EBITDA margins to fit your analysis.
- Instant Results: Watch Suzuki's intrinsic value recalculate in real time.
- Clear Visual Outputs: Dashboard charts present valuation results and key metrics effectively.
- Built for Accuracy: A professional-grade tool designed for analysts, investors, and finance professionals.
How It Works
- 1. Access the Template: Download and open the Excel file containing Suzuki Motor Corporation’s (7269T) preloaded data.
- 2. Modify Assumptions: Adjust key inputs such as growth rates, WACC, and capital expenditures.
- 3. Instant Results: The DCF model automatically calculates the intrinsic value and NPV.
- 4. Evaluate Scenarios: Analyze various forecasts to assess different valuation outcomes.
- 5. Present with Confidence: Share professional valuation insights to reinforce your decision-making process.
Why Opt for This Calculator?
- User-Friendly: Ideal for both novice users and seasoned professionals.
- Customizable Inputs: Adjust parameters effortlessly to suit your analysis.
- Real-Time Updates: Observe immediate changes to Suzuki’s valuation as you tweak inputs.
- Preloaded Data: Comes equipped with Suzuki’s actual financial figures for swift assessments.
- Endorsed by Experts: Valued by investors and analysts for making well-informed choices.
Who Should Use This Product?
- Individual Investors: Gain insights to make informed decisions regarding buying or selling Suzuki stock (7269T).
- Financial Analysts: Enhance valuation processes with pre-built financial models tailored for Suzuki Motor Corporation.
- Consultants: Provide accurate and timely valuation insights for clients focused on the automotive industry.
- Business Owners: Learn how large corporations like Suzuki are valued to shape your own business strategies.
- Finance Students: Explore valuation methods using real-world data related to Suzuki Motor Corporation (7269T) and its market performance.
What the Template Contains for Suzuki Motor Corporation (7269T)
- Preloaded SUZUKI Data: Historical and projected financial metrics, including revenue, EBIT, and capital expenditures.
- DCF and WACC Models: High-quality spreadsheets for determining intrinsic value and Weighted Average Cost of Capital.
- Editable Inputs: Yellow-highlighted cells to modify revenue growth, tax rates, and discount rates.
- Financial Statements: Detailed annual and quarterly financial statements for in-depth analysis.
- Key Ratios: Ratios for profitability, leverage, and efficiency to assess performance.
- Dashboard and Charts: Visual representations of valuation results and underlying assumptions.
Disclaimer
All information, articles, and product details provided on this website are for general informational and educational purposes only. We do not claim any ownership over, nor do we intend to infringe upon, any trademarks, copyrights, logos, brand names, or other intellectual property mentioned or depicted on this site. Such intellectual property remains the property of its respective owners, and any references here are made solely for identification or informational purposes, without implying any affiliation, endorsement, or partnership.
We make no representations or warranties, express or implied, regarding the accuracy, completeness, or suitability of any content or products presented. Nothing on this website should be construed as legal, tax, investment, financial, medical, or other professional advice. In addition, no part of this site—including articles or product references—constitutes a solicitation, recommendation, endorsement, advertisement, or offer to buy or sell any securities, franchises, or other financial instruments, particularly in jurisdictions where such activity would be unlawful.
All content is of a general nature and may not address the specific circumstances of any individual or entity. It is not a substitute for professional advice or services. Any actions you take based on the information provided here are strictly at your own risk. You accept full responsibility for any decisions or outcomes arising from your use of this website and agree to release us from any liability in connection with your use of, or reliance upon, the content or products found herein.