
|
Yamaha Motor Co., Ltd. (7272.t) DCF -Bewertung |
Fully Editable: Tailor To Your Needs In Excel Or Sheets
Professional Design: Trusted, Industry-Standard Templates
Investor-Approved Valuation Models
MAC/PC Compatible, Fully Unlocked
No Expertise Is Needed; Easy To Follow
Yamaha Motor Co., Ltd. (7272.T) Bundle
Unser DCF-Taschenrechner von Yamaha Motor Co., Ltd. (7272t), der für die Genauigkeit entwickelt wurde, ermöglicht es Ihnen, die Bewertung des Unternehmens anhand von Finanzdaten mit realer Welt zu bewerten und vollständige Flexibilität zu bieten, um alle wichtigen Parameter für erweiterte Projektionen zu ändern.
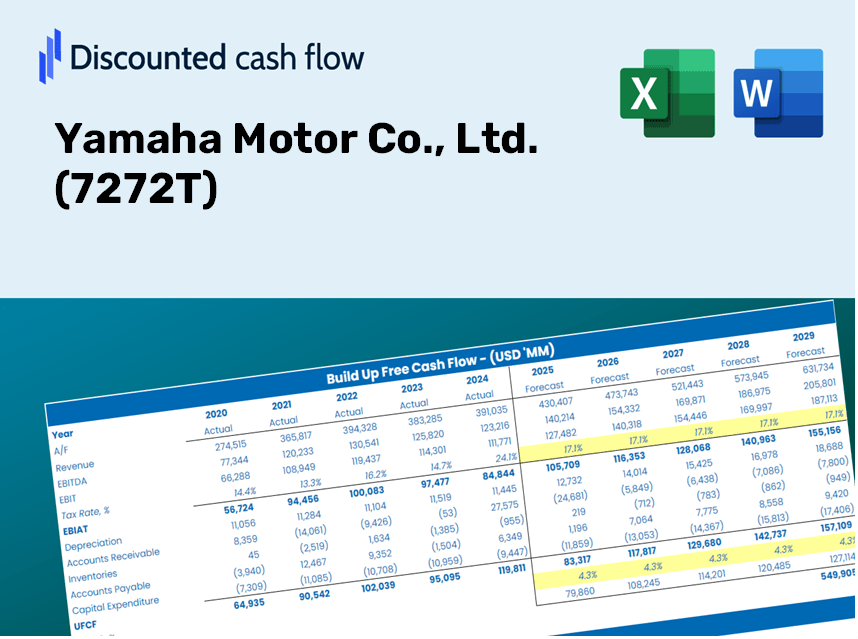
Discounted Cash Flow (DCF) - (USD MM)
| Year | AY1 2020 |
AY2 2021 |
AY3 2022 |
AY4 2023 |
AY5 2024 |
FY1 2025 |
FY2 2026 |
FY3 2027 |
FY4 2028 |
FY5 2029 |
|---|---|---|---|---|---|---|---|---|---|---|
| Revenue | 1,471,298.0 | 1,812,496.0 | 2,248,456.0 | 2,414,759.0 | 2,576,179.0 | 2,971,135.2 | 3,426,642.4 | 3,951,983.8 | 4,557,865.7 | 5,256,636.0 |
| Revenue Growth, % | 0 | 23.19 | 24.05 | 7.4 | 6.68 | 15.33 | 15.33 | 15.33 | 15.33 | 15.33 |
| EBITDA | 136,856.0 | 253,483.0 | 284,689.0 | 314,201.0 | 280,261.0 | 355,580.6 | 410,095.0 | 472,967.0 | 545,477.9 | 629,105.6 |
| EBITDA, % | 9.3 | 13.99 | 12.66 | 13.01 | 10.88 | 11.97 | 11.97 | 11.97 | 11.97 | 11.97 |
| Depreciation | 48,241.0 | 51,129.0 | 59,824.0 | 63,223.0 | 83,067.0 | 86,775.0 | 100,078.6 | 115,421.7 | 133,117.1 | 153,525.4 |
| Depreciation, % | 3.28 | 2.82 | 2.66 | 2.62 | 3.22 | 2.92 | 2.92 | 2.92 | 2.92 | 2.92 |
| EBIT | 88,615.0 | 202,354.0 | 224,865.0 | 250,978.0 | 197,194.0 | 268,805.6 | 310,016.4 | 357,545.3 | 412,360.8 | 475,580.2 |
| EBIT, % | 6.02 | 11.16 | 10 | 10.39 | 7.65 | 9.05 | 9.05 | 9.05 | 9.05 | 9.05 |
| Total Cash | 272,373.0 | 276,412.0 | 299,651.0 | 351,457.0 | 372,999.0 | 452,343.8 | 521,693.0 | 601,674.1 | 693,917.3 | 800,302.4 |
| Total Cash, percent | .0 | .0 | .0 | .0 | .0 | .0 | .0 | .0 | .0 | .0 |
| Account Receivables | 281,084.0 | 301,426.0 | 400,133.0 | 503,805.0 | 550,768.0 | 569,113.0 | 656,364.2 | 756,991.9 | 873,047.0 | 1,006,894.5 |
| Account Receivables, % | 19.1 | 16.63 | 17.8 | 20.86 | 21.38 | 19.15 | 19.15 | 19.15 | 19.15 | 19.15 |
| Inventories | 312,323.0 | 405,359.0 | 525,845.0 | 568,596.0 | 574,105.0 | 670,354.5 | 773,127.1 | 891,655.9 | 1,028,356.4 | 1,186,014.5 |
| Inventories, % | 21.23 | 22.36 | 23.39 | 23.55 | 22.29 | 22.56 | 22.56 | 22.56 | 22.56 | 22.56 |
| Accounts Payable | 121,218.0 | 140,524.0 | 148,133.0 | 154,118.0 | 149,922.0 | 206,684.1 | 238,371.0 | 274,915.9 | 317,063.4 | 365,672.7 |
| Accounts Payable, % | 8.24 | 7.75 | 6.59 | 6.38 | 5.82 | 6.96 | 6.96 | 6.96 | 6.96 | 6.96 |
| Capital Expenditure | -51,396.0 | -66,764.0 | -89,388.0 | -109,912.0 | -115,882.0 | -120,046.9 | -138,451.4 | -159,677.5 | -184,157.8 | -212,391.2 |
| Capital Expenditure, % | -3.49 | -3.68 | -3.98 | -4.55 | -4.5 | -4.04 | -4.04 | -4.04 | -4.04 | -4.04 |
| Tax Rate, % | 41 | 41 | 41 | 41 | 41 | 41 | 41 | 41 | 41 | 41 |
| EBITAT | 55,335.6 | 157,642.5 | 159,583.2 | 170,432.3 | 116,339.9 | 181,832.3 | 209,709.2 | 241,859.8 | 278,939.6 | 321,704.0 |
| Depreciation | ||||||||||
| Changes in Account Receivables | ||||||||||
| Changes in Inventories | ||||||||||
| Changes in Accounts Payable | ||||||||||
| Capital Expenditure | ||||||||||
| UFCF | -420,008.4 | 47,935.5 | -81,564.8 | -16,694.7 | 26,856.9 | 90,728.0 | 12,999.4 | 14,992.4 | 17,290.9 | 19,941.8 |
| WACC, % | 4.96 | 5.22 | 5.1 | 5.05 | 4.9 | 5.05 | 5.05 | 5.05 | 5.05 | 5.05 |
| PV UFCF | ||||||||||
| SUM PV UFCF | 140,876.0 | |||||||||
| Long Term Growth Rate, % | 0.50 | |||||||||
| Free cash flow (T + 1) | 20,041 | |||||||||
| Terminal Value | 440,879 | |||||||||
| Present Terminal Value | 344,688 | |||||||||
| Enterprise Value | 485,564 | |||||||||
| Net Debt | 578,974 | |||||||||
| Equity Value | -93,410 | |||||||||
| Diluted Shares Outstanding, MM | 982 | |||||||||
| Equity Value Per Share | -95.16 |
What You Will Receive
- Authentic YAMAHA Financial Data: Pre-populated with Yamaha Motor Co., Ltd.'s historical and projected data for accurate analysis.
- Completely Customizable Template: Easily adjust key inputs such as revenue growth, WACC, and EBITDA %.
- Instant Calculations: Observe real-time updates to Yamaha's intrinsic value as you make changes.
- Expert Valuation Tool: Tailored for investors, analysts, and consultants who demand precise DCF outcomes.
- Intuitive User Interface: Streamlined layout and straightforward instructions suitable for all skill levels.
Key Features
- Genuine Yamaha Financial Data: Access precise pre-loaded historical figures and future forecasts.
- Flexible Forecast Parameters: Modify yellow-highlighted fields such as WACC, growth rates, and profit margins.
- Automated Calculations: Instant updates for DCF, Net Present Value (NPV), and cash flow evaluations.
- Interactive Dashboard: User-friendly charts and summaries to help you visualize your valuation outcomes.
- Suitable for All Skill Levels: A straightforward, intuitive design tailored for investors, CFOs, and consultants alike.
How It Functions
- 1. Access the Template: Download and open the Excel file featuring Yamaha Motor Co., Ltd.'s preloaded data.
- 2. Modify Key Inputs: Adjust important variables such as growth rates, WACC, and capital expenditures.
- 3. View Instant Results: The DCF model automatically computes intrinsic value and NPV in real-time.
- 4. Explore Various Scenarios: Evaluate multiple forecasts to investigate different valuation possibilities.
- 5. Present with Assurance: Share professional valuation insights to enhance your decision-making process.
Why Choose This Calculator for Yamaha Motor Co., Ltd. (7272T)?
- User-Friendly Interface: Crafted for both novices and seasoned analysts.
- Customizable Parameters: Effortlessly adjust inputs to suit your evaluation needs.
- Real-Time Valuation: Observe immediate changes in Yamaha’s financial metrics as you tweak variables.
- Preconfigured Data: Comes with Yamaha’s actual financial information for swift assessments.
- Preferred by Industry Experts: Reliably utilized by investors and analysts for strategic decision-making.
Who Should Use This Product?
- Investors: Assess Yamaha Motor Co.’s valuation before making buy or sell decisions on stocks.
- CFOs and Financial Analysts: Optimize valuation methodologies and validate financial projections.
- Startup Founders: Gain insights into how established companies like Yamaha Motor Co. are valued.
- Consultants: Provide comprehensive valuation reports for your clients involving Yamaha Motor Co. (7272T).
- Students and Educators: Utilize authentic data to practice and teach valuation strategies.
Contents of the Template
- Operating and Balance Sheet Data: Pre-filled Yamaha Motor Co., Ltd. (7272T) historical data and forecasts, including revenue, EBITDA, EBIT, and capital expenditures.
- WACC Calculation: A dedicated sheet for the Weighted Average Cost of Capital (WACC), featuring parameters such as Beta, risk-free rate, and share price.
- DCF Valuation (Unlevered and Levered): Editable Discounted Cash Flow models that present intrinsic value with comprehensive calculations.
- Financial Statements: Pre-loaded annual and quarterly financial statements to facilitate analysis.
- Key Ratios: A collection of key ratios covering profitability, leverage, and efficiency for Yamaha Motor Co., Ltd. (7272T).
- Dashboard and Charts: A visual summary of valuation outputs and assumptions for straightforward analysis of results.
Disclaimer
All information, articles, and product details provided on this website are for general informational and educational purposes only. We do not claim any ownership over, nor do we intend to infringe upon, any trademarks, copyrights, logos, brand names, or other intellectual property mentioned or depicted on this site. Such intellectual property remains the property of its respective owners, and any references here are made solely for identification or informational purposes, without implying any affiliation, endorsement, or partnership.
We make no representations or warranties, express or implied, regarding the accuracy, completeness, or suitability of any content or products presented. Nothing on this website should be construed as legal, tax, investment, financial, medical, or other professional advice. In addition, no part of this site—including articles or product references—constitutes a solicitation, recommendation, endorsement, advertisement, or offer to buy or sell any securities, franchises, or other financial instruments, particularly in jurisdictions where such activity would be unlawful.
All content is of a general nature and may not address the specific circumstances of any individual or entity. It is not a substitute for professional advice or services. Any actions you take based on the information provided here are strictly at your own risk. You accept full responsibility for any decisions or outcomes arising from your use of this website and agree to release us from any liability in connection with your use of, or reliance upon, the content or products found herein.