
|
Atom Corporation (7412.T) DCF -Bewertung |
Fully Editable: Tailor To Your Needs In Excel Or Sheets
Professional Design: Trusted, Industry-Standard Templates
Investor-Approved Valuation Models
MAC/PC Compatible, Fully Unlocked
No Expertise Is Needed; Easy To Follow
ATOM Corporation (7412.T) Bundle
Bewerten Sie die finanziellen Aussichten der Atom Corporation wie ein Experte! Dieser (7412T) DCF-Rechner bietet vorgefüllte Finanzdaten sowie die vollständige Flexibilität, um das Umsatzwachstum, WACC, Margen und andere kritische Annahmen zu ändern, um sich mit Ihren Vorhersagen auszurichten.
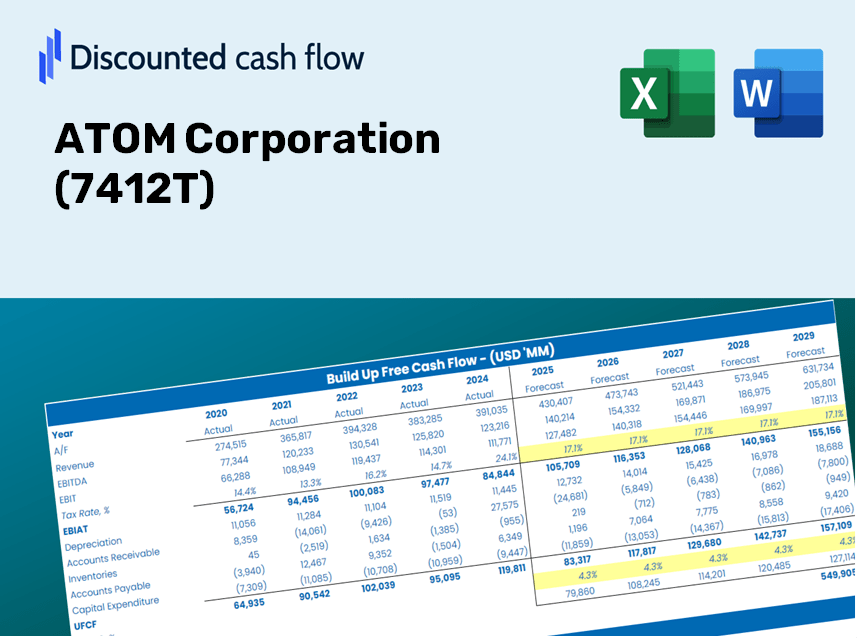
Discounted Cash Flow (DCF) - (USD MM)
| Year | AY1 2020 |
AY2 2021 |
AY3 2022 |
AY4 2023 |
AY5 2024 |
FY1 2025 |
FY2 2026 |
FY3 2027 |
FY4 2028 |
FY5 2029 |
|---|---|---|---|---|---|---|---|---|---|---|
| Revenue | 32,185.0 | 31,098.0 | 35,239.0 | 36,947.0 | 35,477.0 | 36,435.5 | 37,419.9 | 38,430.8 | 39,469.1 | 40,535.5 |
| Revenue Growth, % | 0 | -3.38 | 13.32 | 4.85 | -3.98 | 2.7 | 2.7 | 2.7 | 2.7 | 2.7 |
| EBITDA | -743.0 | 2,903.0 | -1,108.0 | -76.0 | 2,313.0 | 743.0 | 763.1 | 783.7 | 804.9 | 826.6 |
| EBITDA, % | -2.31 | 9.34 | -3.14 | -0.2057 | 6.52 | 2.04 | 2.04 | 2.04 | 2.04 | 2.04 |
| Depreciation | 1,278.0 | 1,093.0 | 1,122.0 | 1,110.0 | 920.0 | 1,185.4 | 1,217.4 | 1,250.3 | 1,284.1 | 1,318.8 |
| Depreciation, % | 3.97 | 3.51 | 3.18 | 3 | 2.59 | 3.25 | 3.25 | 3.25 | 3.25 | 3.25 |
| EBIT | -2,021.0 | 1,810.0 | -2,230.0 | -1,186.0 | 1,393.0 | -442.4 | -454.3 | -466.6 | -479.2 | -492.2 |
| EBIT, % | -6.28 | 5.82 | -6.33 | -3.21 | 3.93 | -1.21 | -1.21 | -1.21 | -1.21 | -1.21 |
| Total Cash | 5,322.0 | 7,067.0 | 5,568.0 | 4,664.0 | 6,703.0 | 6,309.1 | 6,479.5 | 6,654.6 | 6,834.4 | 7,019.0 |
| Total Cash, percent | .0 | .0 | .0 | .0 | .0 | .0 | .0 | .0 | .0 | .0 |
| Account Receivables | 1,947.0 | 2,086.0 | 1,332.0 | 1,359.0 | 1,299.0 | 1,739.9 | 1,786.9 | 1,835.2 | 1,884.8 | 1,935.7 |
| Account Receivables, % | 6.05 | 6.71 | 3.78 | 3.68 | 3.66 | 4.78 | 4.78 | 4.78 | 4.78 | 4.78 |
| Inventories | 270.0 | 252.0 | 275.0 | 263.0 | 274.0 | 285.2 | 292.9 | 300.8 | 308.9 | 317.3 |
| Inventories, % | 0.8389 | 0.81034 | 0.78039 | 0.71183 | 0.77233 | 0.78276 | 0.78276 | 0.78276 | 0.78276 | 0.78276 |
| Accounts Payable | 2,086.0 | 2,019.0 | 2,516.0 | 2,404.0 | 2,371.0 | 2,426.8 | 2,492.4 | 2,559.7 | 2,628.9 | 2,699.9 |
| Accounts Payable, % | 6.48 | 6.49 | 7.14 | 6.51 | 6.68 | 6.66 | 6.66 | 6.66 | 6.66 | 6.66 |
| Capital Expenditure | -83.0 | -173.0 | -2,487.0 | -1,958.0 | -782.0 | -1,120.4 | -1,150.7 | -1,181.8 | -1,213.7 | -1,246.5 |
| Capital Expenditure, % | -0.25788 | -0.55631 | -7.06 | -5.3 | -2.2 | -3.08 | -3.08 | -3.08 | -3.08 | -3.08 |
| Tax Rate, % | 59.97 | 59.97 | 59.97 | 59.97 | 59.97 | 59.97 | 59.97 | 59.97 | 59.97 | 59.97 |
| EBITAT | -1,754.8 | 776.8 | -2,111.0 | -1,401.5 | 557.6 | -322.4 | -331.2 | -340.1 | -349.3 | -358.7 |
| Depreciation | ||||||||||
| Changes in Account Receivables | ||||||||||
| Changes in Inventories | ||||||||||
| Changes in Accounts Payable | ||||||||||
| Capital Expenditure | ||||||||||
| UFCF | -690.8 | 1,508.8 | -2,248.0 | -2,376.5 | 711.6 | -653.8 | -253.6 | -260.4 | -267.5 | -274.7 |
| WACC, % | 4.61 | 4.53 | 4.63 | 4.64 | 4.53 | 4.59 | 4.59 | 4.59 | 4.59 | 4.59 |
| PV UFCF | ||||||||||
| SUM PV UFCF | -1,527.5 | |||||||||
| Long Term Growth Rate, % | 2.00 | |||||||||
| Free cash flow (T + 1) | -280 | |||||||||
| Terminal Value | -10,821 | |||||||||
| Present Terminal Value | -8,647 | |||||||||
| Enterprise Value | -10,174 | |||||||||
| Net Debt | -1,328 | |||||||||
| Equity Value | -8,846 | |||||||||
| Diluted Shares Outstanding, MM | 193 | |||||||||
| Equity Value Per Share | -45.81 |
Benefits of Choosing ATOM Corporation (7412T)
- Adjustable Forecast Inputs: Easily modify key assumptions (growth %, margins, WACC) to explore various scenarios.
- Comprehensive Data: Financial data for ATOM Corporation (7412T) pre-filled to kickstart your analysis.
- Automated DCF Calculations: The template provides instant calculations of Net Present Value (NPV) and intrinsic value.
- Tailored and Professional: A refined Excel model that suits your specific valuation requirements.
- Designed for Analysts and Investors: Perfect for testing projections, validating strategies, and enhancing efficiency.
Key Features
- 🔍 Real-Life ATOM Financials: Pre-filled historical and projected data for ATOM Corporation (7412T).
- ✏️ Fully Customizable Inputs: Tailor all essential parameters (yellow cells) such as WACC, growth %, and tax rates.
- 📊 Professional DCF Valuation: Integrated formulas compute ATOM’s intrinsic value through the Discounted Cash Flow method.
- ⚡ Instant Results: Visualize ATOM’s valuation immediately after adjustments are made.
- Scenario Analysis: Experiment and compare outcomes for different financial assumptions side-by-side.
How It Works
- Step 1: Download the Excel file.
- Step 2: Examine ATOM Corporation’s (7412T) pre-filled financial data and projections.
- Step 3: Adjust key inputs such as revenue growth, WACC, and tax rates (highlighted cells).
- Step 4: Observe the DCF model update in real-time as you modify your assumptions.
- Step 5: Evaluate the outputs to inform your investment strategies.
Why Opt for ATOM Corporation's Calculator?
- User-Friendly Design: Suitable for both novices and seasoned professionals.
- Customizable Parameters: Adjust inputs effortlessly to tailor your analysis.
- Real-Time Feedback: Observe immediate changes in ATOM Corporation's valuation as you tweak inputs.
- Preconfigured Data: Comes loaded with ATOM Corporation's latest financial metrics for swift evaluations.
- Preferred by Experts: Utilized by investors and analysts for making knowledgeable choices.
Who Can Benefit from ATOM Corporation (7412T)?
- Investors: Make informed choices with our advanced valuation tools.
- Financial Analysts: Streamline your workflow with our customizable DCF model.
- Consultants: Easily modify the template for impactful client presentations or reports.
- Finance Enthusiasts: Enhance your knowledge of valuation methods through real-world case studies.
- Educators and Students: Utilize this resource as a hands-on learning tool in finance programs.
What the Template Includes
- Historical Data: Contains ATOM Corporation’s previous financial performance and foundational forecasts.
- DCF and Levered DCF Models: Comprehensive templates for calculating the intrinsic value of ATOM Corporation.
- WACC Sheet: Ready-to-use calculations for the Weighted Average Cost of Capital.
- Editable Inputs: Adjust key drivers such as growth rates, EBITDA percentages, and CAPEX assumptions.
- Quarterly and Annual Statements: Thorough analysis of ATOM Corporation’s financial statements.
- Interactive Dashboard: Dynamically visualize valuation results and future projections.
Disclaimer
All information, articles, and product details provided on this website are for general informational and educational purposes only. We do not claim any ownership over, nor do we intend to infringe upon, any trademarks, copyrights, logos, brand names, or other intellectual property mentioned or depicted on this site. Such intellectual property remains the property of its respective owners, and any references here are made solely for identification or informational purposes, without implying any affiliation, endorsement, or partnership.
We make no representations or warranties, express or implied, regarding the accuracy, completeness, or suitability of any content or products presented. Nothing on this website should be construed as legal, tax, investment, financial, medical, or other professional advice. In addition, no part of this site—including articles or product references—constitutes a solicitation, recommendation, endorsement, advertisement, or offer to buy or sell any securities, franchises, or other financial instruments, particularly in jurisdictions where such activity would be unlawful.
All content is of a general nature and may not address the specific circumstances of any individual or entity. It is not a substitute for professional advice or services. Any actions you take based on the information provided here are strictly at your own risk. You accept full responsibility for any decisions or outcomes arising from your use of this website and agree to release us from any liability in connection with your use of, or reliance upon, the content or products found herein.