
|
Pan Pacific International Holdings Corporation (7532.t) DCF -Bewertung |
Fully Editable: Tailor To Your Needs In Excel Or Sheets
Professional Design: Trusted, Industry-Standard Templates
Investor-Approved Valuation Models
MAC/PC Compatible, Fully Unlocked
No Expertise Is Needed; Easy To Follow
Pan Pacific International Holdings Corporation (7532.T) Bundle
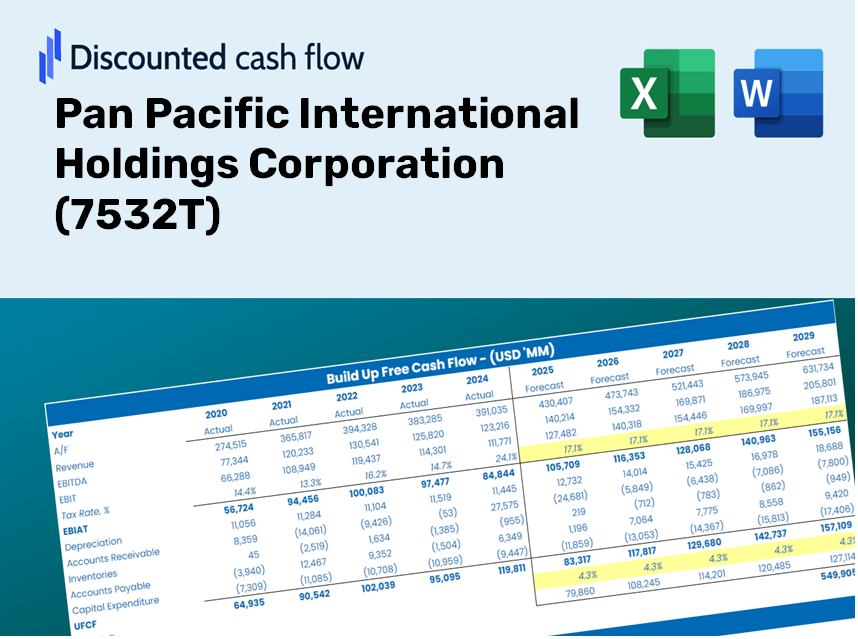
Unser (7532T) DCF-Taschenrechner wurde für die Genauigkeit entwickelt und ermöglicht es Ihnen, die Bewertung der Pan Pacific International Holdings Corporation anhand von Finanzdaten in der Pan Pacific International zu bewerten und vollständige Flexibilität zu bieten, um alle wesentlichen Parameter für verbesserte Projektionen zu ändern.
Benefits You Will Receive
- Accurate 7532T Financial Data: Provides both historical and projected figures for precise valuation.
- Customizable Inputs: Adjust parameters such as WACC, tax rates, revenue growth, and capital expenditures.
- Dynamic Calculations: Intrinsic value and NPV are computed in real-time.
- Scenario Analysis: Explore various scenarios to assess the future outlook of Pan Pacific International Holdings Corporation.
- User-Friendly Interface: Designed for professionals but easy to navigate for newcomers.
Key Features
- Comprehensive DCF Calculator: Offers in-depth unlevered and levered DCF valuation models tailored for Pan Pacific International Holdings Corporation (7532T).
- WACC Calculator: Features a pre-configured Weighted Average Cost of Capital sheet with adjustable parameters.
- Customizable Forecast Inputs: Easily alter growth projections, capital expenditure plans, and discount rates.
- Integrated Financial Ratios: Evaluate profitability, leverage, and efficiency ratios specific to Pan Pacific International Holdings Corporation (7532T).
- Interactive Dashboard and Charts: Visual representations highlight essential valuation metrics for straightforward analysis.
How It Functions
- Download: Obtain the pre-filled Excel file featuring Pan Pacific International Holdings Corporation's (7532T) financial data.
- Customize: Modify forecasts, such as revenue growth, EBITDA %, and WACC to suit your analysis.
- Update Automatically: Watch as the intrinsic value and NPV calculations refresh in real-time.
- Test Scenarios: Develop various projections and analyze outcomes without delay.
- Make Decisions: Leverage the valuation insights to inform your investment strategy.
Why Choose This Calculator for Pan Pacific International Holdings Corporation (7532T)?
- User-Friendly Interface: Ideal for both newcomers and seasoned professionals.
- Customizable Inputs: Tailor assumptions easily to suit your analytical needs.
- Real-Time Results: Watch Pan Pacific International's valuation update instantly as you tweak the figures.
- Pre-Configured Data: Comes equipped with actual financial data from Pan Pacific for swift evaluations.
- Relied Upon by Experts: A trusted tool for investors and analysts to facilitate informed decision-making.
Who Can Benefit from This Product?
- Institutional Investors: Create comprehensive and accurate valuation models for analyzing portfolios involving Pan Pacific International Holdings Corporation (7532T).
- Corporate Finance Departments: Evaluate various valuation scenarios to inform organizational strategies related to Pan Pacific International Holdings Corporation (7532T).
- Consultants and Financial Advisors: Deliver precise valuation insights to clients focusing on Pan Pacific International Holdings Corporation (7532T).
- Students and Educators: Utilize real-life data to enhance learning and practice in financial modeling for Pan Pacific International Holdings Corporation (7532T).
- Market Enthusiasts: Gain a deeper understanding of how companies like Pan Pacific International Holdings Corporation (7532T) are valued in the marketplace.
Overview of the Template Features
- Comprehensive DCF Model: An editable template featuring detailed valuation calculations.
- Real-World Data: Historical and projected financial data for Pan Pacific International Holdings Corporation (7532T) preloaded for in-depth analysis.
- Customizable Parameters: Flexibly adjust WACC, growth rates, and tax assumptions to explore different scenarios.
- Financial Statements: Complete annual and quarterly breakdowns for enhanced insights.
- Key Ratios: Integrated analysis tools for assessing profitability, efficiency, and leverage.
- Dashboard with Visual Outputs: User-friendly charts and tables presenting clear, actionable results.
Disclaimer
All information, articles, and product details provided on this website are for general informational and educational purposes only. We do not claim any ownership over, nor do we intend to infringe upon, any trademarks, copyrights, logos, brand names, or other intellectual property mentioned or depicted on this site. Such intellectual property remains the property of its respective owners, and any references here are made solely for identification or informational purposes, without implying any affiliation, endorsement, or partnership.
We make no representations or warranties, express or implied, regarding the accuracy, completeness, or suitability of any content or products presented. Nothing on this website should be construed as legal, tax, investment, financial, medical, or other professional advice. In addition, no part of this site—including articles or product references—constitutes a solicitation, recommendation, endorsement, advertisement, or offer to buy or sell any securities, franchises, or other financial instruments, particularly in jurisdictions where such activity would be unlawful.
All content is of a general nature and may not address the specific circumstances of any individual or entity. It is not a substitute for professional advice or services. Any actions you take based on the information provided here are strictly at your own risk. You accept full responsibility for any decisions or outcomes arising from your use of this website and agree to release us from any liability in connection with your use of, or reliance upon, the content or products found herein.