
|
Ichibanya Co., Ltd. (7630.T) DCF -Bewertung |
Fully Editable: Tailor To Your Needs In Excel Or Sheets
Professional Design: Trusted, Industry-Standard Templates
Investor-Approved Valuation Models
MAC/PC Compatible, Fully Unlocked
No Expertise Is Needed; Easy To Follow
Ichibanya Co., Ltd. (7630.T) Bundle
Bewerten Sie die finanzielle Aussichten von Ichibanya Co., Ltd. wie ein Profi! Dieser (7630T) DCF-Taschenrechner bietet vorgefüllte Finanzdaten sowie die Flexibilität, das Umsatzwachstum, WACC, Margen und andere wichtige Annahmen zu ändern, um sich an Ihren Projektionen anzupassen.
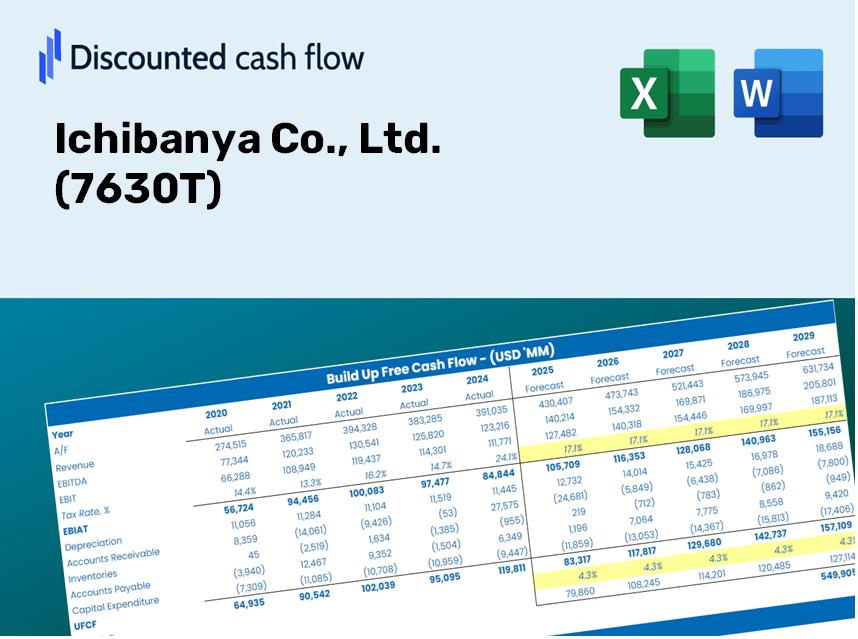
Discounted Cash Flow (DCF) - (USD MM)
| Year | AY1 2020 |
AY2 2021 |
AY3 2022 |
AY4 2023 |
AY5 2024 |
FY1 2025 |
FY2 2026 |
FY3 2027 |
FY4 2028 |
FY5 2029 |
|---|---|---|---|---|---|---|---|---|---|---|
| Revenue | 44,246.7 | 45,022.2 | 48,287.0 | 55,137.3 | 61,006.7 | 66,167.2 | 71,764.2 | 77,834.7 | 84,418.7 | 91,559.6 |
| Revenue Growth, % | 0 | 1.75 | 7.25 | 14.19 | 10.64 | 8.46 | 8.46 | 8.46 | 8.46 | 8.46 |
| EBITDA | 4,142.4 | 6,047.6 | 5,565.3 | 6,145.0 | 6,749.5 | 7,480.6 | 8,113.4 | 8,799.7 | 9,544.1 | 10,351.4 |
| EBITDA, % | 9.36 | 13.43 | 11.53 | 11.14 | 11.06 | 11.31 | 11.31 | 11.31 | 11.31 | 11.31 |
| Depreciation | 1,414.9 | 1,563.1 | 1,624.8 | 1,806.4 | 1,980.9 | 2,191.1 | 2,376.5 | 2,577.5 | 2,795.5 | 3,032.0 |
| Depreciation, % | 3.2 | 3.47 | 3.36 | 3.28 | 3.25 | 3.31 | 3.31 | 3.31 | 3.31 | 3.31 |
| EBIT | 2,727.5 | 4,484.5 | 3,940.5 | 4,338.6 | 4,768.6 | 5,289.5 | 5,736.9 | 6,222.2 | 6,748.5 | 7,319.4 |
| EBIT, % | 6.16 | 9.96 | 8.16 | 7.87 | 7.82 | 7.99 | 7.99 | 7.99 | 7.99 | 7.99 |
| Total Cash | 15,801.2 | 17,587.5 | 17,690.4 | 15,899.6 | 15,480.7 | 21,917.6 | 23,771.6 | 25,782.5 | 27,963.4 | 30,328.8 |
| Total Cash, percent | .0 | .0 | .0 | .0 | .0 | .0 | .0 | .0 | .0 | .0 |
| Account Receivables | 2,561.0 | 2,685.5 | 3,161.7 | 3,403.9 | 3,677.8 | 4,036.5 | 4,378.0 | 4,748.3 | 5,150.0 | 5,585.6 |
| Account Receivables, % | 5.79 | 5.96 | 6.55 | 6.17 | 6.03 | 6.1 | 6.1 | 6.1 | 6.1 | 6.1 |
| Inventories | 1,147.2 | 1,258.3 | 1,309.9 | 1,319.8 | 1,209.0 | 1,651.0 | 1,790.6 | 1,942.1 | 2,106.4 | 2,284.6 |
| Inventories, % | 2.59 | 2.79 | 2.71 | 2.39 | 1.98 | 2.5 | 2.5 | 2.5 | 2.5 | 2.5 |
| Accounts Payable | 2,047.8 | 2,132.0 | 2,312.5 | 2,581.8 | 2,878.5 | 3,116.9 | 3,380.6 | 3,666.6 | 3,976.7 | 4,313.1 |
| Accounts Payable, % | 4.63 | 4.74 | 4.79 | 4.68 | 4.72 | 4.71 | 4.71 | 4.71 | 4.71 | 4.71 |
| Capital Expenditure | -1,826.9 | -1,369.2 | -1,396.7 | -2,206.4 | -2,438.7 | -2,390.2 | -2,592.4 | -2,811.6 | -3,049.5 | -3,307.4 |
| Capital Expenditure, % | -4.13 | -3.04 | -2.89 | -4 | -4 | -3.61 | -3.61 | -3.61 | -3.61 | -3.61 |
| Tax Rate, % | 33.25 | 33.25 | 33.25 | 33.25 | 33.25 | 33.25 | 33.25 | 33.25 | 33.25 | 33.25 |
| EBITAT | 1,747.0 | 2,931.5 | 2,547.1 | 2,692.7 | 3,183.1 | 3,415.7 | 3,704.6 | 4,018.0 | 4,357.9 | 4,726.5 |
| Depreciation | ||||||||||
| Changes in Account Receivables | ||||||||||
| Changes in Inventories | ||||||||||
| Changes in Accounts Payable | ||||||||||
| Capital Expenditure | ||||||||||
| UFCF | -325.2 | 2,973.9 | 2,428.0 | 2,309.7 | 2,859.0 | 2,654.4 | 3,271.3 | 3,548.1 | 3,848.2 | 4,173.7 |
| WACC, % | 5.43 | 5.43 | 5.43 | 5.43 | 5.43 | 5.43 | 5.43 | 5.43 | 5.43 | 5.43 |
| PV UFCF | ||||||||||
| SUM PV UFCF | 14,807.5 | |||||||||
| Long Term Growth Rate, % | 3.00 | |||||||||
| Free cash flow (T + 1) | 4,299 | |||||||||
| Terminal Value | 177,001 | |||||||||
| Present Terminal Value | 135,888 | |||||||||
| Enterprise Value | 150,695 | |||||||||
| Net Debt | -13,981 | |||||||||
| Equity Value | 164,677 | |||||||||
| Diluted Shares Outstanding, MM | 160 | |||||||||
| Equity Value Per Share | 1,032.15 |
What You'll Receive
- Comprehensive Financial Model: Leverage Ichibanya's actual data for accurate DCF valuation.
- Complete Forecasting Control: Modify revenue growth, profit margins, WACC, and other critical factors.
- Real-Time Calculations: Automatic updates provide immediate feedback as adjustments are made.
- Professional-Ready Template: A polished Excel file crafted for high-level valuation.
- Flexible and Reusable: Designed for adaptability, making it ideal for in-depth, repeated forecasting.
Key Features
- Comprehensive Ichibanya Data: Pre-populated with Ichibanya Co., Ltd.'s historical performance metrics and future growth estimates.
- Customizable Financial Inputs: Tailor revenue growth rates, profit margins, discount rates, tax assumptions, and capital investments.
- Interactive Valuation Model: Automatically refreshes Net Present Value (NPV) and intrinsic value calculations based on user inputs.
- Multiple Scenario Analysis: Develop various forecasting scenarios to explore differing valuation results.
- User-Centric Interface: Intuitive and organized, catering to both experienced professionals and newcomers.
How It Functions
- Step 1: Download the ready-to-use Excel template featuring Ichibanya Co., Ltd.'s data.
- Step 2: Navigate through the filled sheets to familiarize yourself with the essential metrics.
- Step 3: Modify forecasts and assumptions in the editable yellow cells (WACC, growth, margins).
- Step 4: Immediately see the updated results, including the intrinsic value of Ichibanya Co., Ltd. (7630T).
- Step 5: Make well-informed investment choices or create reports based on the generated outputs.
Why Choose Ichibanya Co., Ltd. (7630T) Calculator?
- Precision: Incorporates real financial data from Ichibanya for reliable results.
- Customization: Users can easily manipulate and test various inputs.
- Efficiency: Eliminate the need to create a financial model from the ground up.
- Expert-Level: Crafted with the accuracy and practicality required by financial professionals.
- Intuitive: Designed for simplicity, making it accessible for all users, regardless of their financial expertise.
Who Should Benefit from Ichibanya Co., Ltd. ([7630T])?
- Investors: Develop comprehensive and trustworthy valuation models for portfolio assessment.
- Corporate Finance Departments: Evaluate valuation scenarios to support strategic decision-making.
- Consultants and Financial Advisors: Offer clients precise valuation insights for Ichibanya Co., Ltd. ([7630T]).
- Students and Instructors: Utilize real-world data for practicing and teaching financial modeling techniques.
- Culinary Enthusiasts: Gain an understanding of how dining and food service companies like Ichibanya are valued in the market.
Contents of the Template
- Pre-Filled DCF Model: Ichibanya Co., Ltd.’s financial data preloaded for immediate analysis.
- WACC Calculator: Comprehensive calculations for Weighted Average Cost of Capital.
- Financial Ratios: Assess Ichibanya's profitability, leverage, and operational efficiency.
- Editable Inputs: Adjust assumptions such as growth rates, profit margins, and CAPEX to align with your projections.
- Financial Statements: Access annual and quarterly reports for thorough examination.
- Interactive Dashboard: Effortlessly visualize essential valuation metrics and outcomes.
Disclaimer
All information, articles, and product details provided on this website are for general informational and educational purposes only. We do not claim any ownership over, nor do we intend to infringe upon, any trademarks, copyrights, logos, brand names, or other intellectual property mentioned or depicted on this site. Such intellectual property remains the property of its respective owners, and any references here are made solely for identification or informational purposes, without implying any affiliation, endorsement, or partnership.
We make no representations or warranties, express or implied, regarding the accuracy, completeness, or suitability of any content or products presented. Nothing on this website should be construed as legal, tax, investment, financial, medical, or other professional advice. In addition, no part of this site—including articles or product references—constitutes a solicitation, recommendation, endorsement, advertisement, or offer to buy or sell any securities, franchises, or other financial instruments, particularly in jurisdictions where such activity would be unlawful.
All content is of a general nature and may not address the specific circumstances of any individual or entity. It is not a substitute for professional advice or services. Any actions you take based on the information provided here are strictly at your own risk. You accept full responsibility for any decisions or outcomes arising from your use of this website and agree to release us from any liability in connection with your use of, or reliance upon, the content or products found herein.