
|
Sugi Holdings Co., Ltd. (7649.t) DCF -Bewertung |
Fully Editable: Tailor To Your Needs In Excel Or Sheets
Professional Design: Trusted, Industry-Standard Templates
Investor-Approved Valuation Models
MAC/PC Compatible, Fully Unlocked
No Expertise Is Needed; Easy To Follow
Sugi Holdings Co.,Ltd. (7649.T) Bundle
Möchten Sie den inneren Wert von Sugi Holdings Co., Ltd. beurteilen? Unser (7649T) DCF-Taschenrechner integriert reale Daten mit umfangreichen Anpassungsfunktionen, sodass Sie Ihre Prognosen verfeinern und fundiertere Investitionsentscheidungen treffen können.
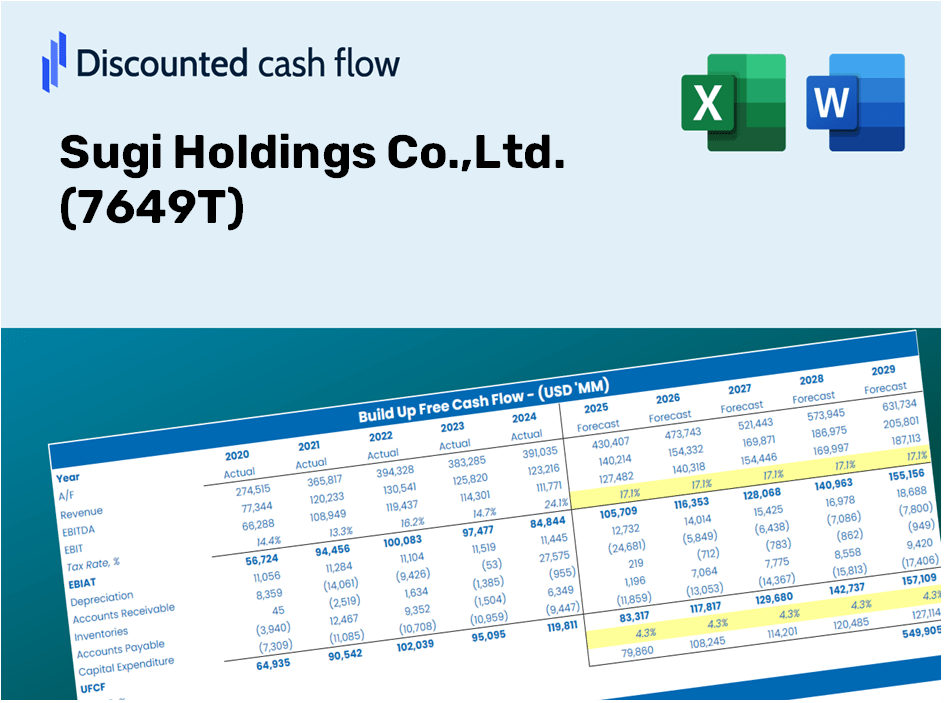
Discounted Cash Flow (DCF) - (USD MM)
| Year | AY1 2021 |
AY2 2022 |
AY3 2023 |
AY4 2024 |
AY5 2025 |
FY1 2026 |
FY2 2027 |
FY3 2028 |
FY4 2029 |
FY5 2030 |
|---|---|---|---|---|---|---|---|---|---|---|
| Revenue | 602,510.0 | 625,477.0 | 667,647.0 | 744,477.0 | 878,021.0 | 916,418.0 | 956,494.1 | 998,322.8 | 1,041,980.7 | 1,087,547.9 |
| Revenue Growth, % | 0 | 3.81 | 6.74 | 11.51 | 17.94 | 4.37 | 4.37 | 4.37 | 4.37 | 4.37 |
| EBITDA | 41,482.0 | 38,743.0 | 40,562.0 | 46,240.0 | 56,177.0 | 58,217.5 | 60,763.4 | 63,420.6 | 66,194.1 | 69,088.9 |
| EBITDA, % | 6.88 | 6.19 | 6.08 | 6.21 | 6.4 | 6.35 | 6.35 | 6.35 | 6.35 | 6.35 |
| Depreciation | 9,940.0 | 11,268.0 | 12,362.0 | 14,121.0 | 17,871.0 | 16,926.2 | 17,666.4 | 18,439.0 | 19,245.4 | 20,087.0 |
| Depreciation, % | 1.65 | 1.8 | 1.85 | 1.9 | 2.04 | 1.85 | 1.85 | 1.85 | 1.85 | 1.85 |
| EBIT | 31,542.0 | 27,475.0 | 28,200.0 | 32,119.0 | 38,306.0 | 41,291.2 | 43,097.0 | 44,981.6 | 46,948.7 | 49,001.9 |
| EBIT, % | 5.24 | 4.39 | 4.22 | 4.31 | 4.36 | 4.51 | 4.51 | 4.51 | 4.51 | 4.51 |
| Total Cash | 95,845.0 | 71,831.0 | 70,642.0 | 47,427.0 | 52,788.0 | 92,292.9 | 96,329.0 | 100,541.5 | 104,938.3 | 109,527.4 |
| Total Cash, percent | .0 | .0 | .0 | .0 | .0 | .0 | .0 | .0 | .0 | .0 |
| Account Receivables | 31,654.0 | 33,576.0 | 37,514.0 | 44,376.0 | 70,673.0 | 55,444.0 | 57,868.7 | 60,399.3 | 63,040.7 | 65,797.5 |
| Account Receivables, % | 5.25 | 5.37 | 5.62 | 5.96 | 8.05 | 6.05 | 6.05 | 6.05 | 6.05 | 6.05 |
| Inventories | 71,165.0 | 71,571.0 | 74,503.0 | 83,679.0 | 94,008.0 | 103,298.4 | 107,815.8 | 112,530.7 | 117,451.8 | 122,588.1 |
| Inventories, % | 11.81 | 11.44 | 11.16 | 11.24 | 10.71 | 11.27 | 11.27 | 11.27 | 11.27 | 11.27 |
| Accounts Payable | 91,061.0 | 70,987.0 | 77,038.0 | 90,621.0 | 121,197.0 | 117,260.2 | 122,388.1 | 127,740.3 | 133,326.6 | 139,157.1 |
| Accounts Payable, % | 15.11 | 11.35 | 11.54 | 12.17 | 13.8 | 12.8 | 12.8 | 12.8 | 12.8 | 12.8 |
| Capital Expenditure | -21,563.0 | -23,379.0 | -21,512.0 | -32,700.0 | -23,626.0 | -32,298.0 | -33,710.4 | -35,184.6 | -36,723.3 | -38,329.3 |
| Capital Expenditure, % | -3.58 | -3.74 | -3.22 | -4.39 | -2.69 | -3.52 | -3.52 | -3.52 | -3.52 | -3.52 |
| Tax Rate, % | 32.54 | 32.54 | 32.54 | 32.54 | 32.54 | 32.54 | 32.54 | 32.54 | 32.54 | 32.54 |
| EBITAT | 21,134.1 | 19,402.4 | 19,017.8 | 21,990.6 | 25,842.1 | 28,159.7 | 29,391.2 | 30,676.5 | 32,018.0 | 33,418.2 |
| Depreciation | ||||||||||
| Changes in Account Receivables | ||||||||||
| Changes in Inventories | ||||||||||
| Changes in Accounts Payable | ||||||||||
| Capital Expenditure | ||||||||||
| UFCF | -2,246.9 | -15,110.6 | 9,048.8 | 956.6 | 14,037.1 | 14,789.7 | 11,533.1 | 12,037.4 | 12,563.8 | 13,113.3 |
| WACC, % | 5.43 | 5.44 | 5.44 | 5.44 | 5.44 | 5.44 | 5.44 | 5.44 | 5.44 | 5.44 |
| PV UFCF | ||||||||||
| SUM PV UFCF | 54,899.8 | |||||||||
| Long Term Growth Rate, % | 2.00 | |||||||||
| Free cash flow (T + 1) | 13,376 | |||||||||
| Terminal Value | 389,120 | |||||||||
| Present Terminal Value | 298,614 | |||||||||
| Enterprise Value | 353,514 | |||||||||
| Net Debt | -7,436 | |||||||||
| Equity Value | 360,950 | |||||||||
| Diluted Shares Outstanding, MM | 181 | |||||||||
| Equity Value Per Share | 1,994.60 |
What You Will Receive
- Authentic Sugi Holdings Data: Comprehensive financials – covering revenue to EBIT – derived from actual and projected metrics.
- Complete Customization: Modify all key parameters (yellow cells) such as WACC, growth %, and tax rates.
- Immediate Valuation Updates: Automatic recalculations to assess the effects of modifications on the fair value of Sugi Holdings Co., Ltd. (7649T).
- Flexible Excel Template: Designed for quick adjustments, scenario analysis, and in-depth projections.
- Efficient and Precise: Avoid the hassle of building models from the ground up while ensuring accuracy and adaptability.
Key Features
- Customizable Forecast Variables: Adjust essential metrics such as revenue growth, EBITDA percentage, and capital expenditures.
- Instant DCF Valuation: Automatically computes intrinsic value, NPV, and other key outputs in real time.
- Precision in Results: Leverages Sugi Holdings Co., Ltd.'s (7649T) actual financial data for accurate valuation insights.
- Effortless Scenario Analysis: Easily evaluate various assumptions and analyze results side by side.
- Efficiency Booster: Streamlines the valuation process by removing the complexity of building models from the ground up.
How It Functions
- Step 1: Download the preconfigured Excel template featuring Sugi Holdings Co., Ltd.'s (7649T) data.
- Step 2: Navigate through the pre-populated sheets to familiarize yourself with the essential metrics.
- Step 3: Adjust forecasts and assumptions in the editable yellow cells (WACC, growth, margins).
- Step 4: Immediately see the updated results, including Sugi Holdings Co., Ltd.'s (7649T) intrinsic value.
- Step 5: Utilize the outputs to make informed investment choices or to create comprehensive reports.
Why Opt for the Sugi Holdings Calculator?
- All-in-One Solution: Combines DCF, WACC, and financial ratio analysis into a single platform.
- Flexible Inputs: Modify the yellow-highlighted fields to explore different scenarios.
- In-Depth Analysis: Automatically computes Sugi Holdings' intrinsic value and Net Present Value.
- Data-Rich: Comes with historical and projected data for precise baseline calculations.
- High-Quality Standards: Perfect for financial analysts, investors, and business consultants specializing in Sugi Holdings (7649T).
Who Should Utilize Sugi Holdings Co., Ltd. (7649T)?
- Investors: Evaluate Sugi Holdings' valuation before making stock transactions.
- CFOs and Financial Analysts: Optimize valuation procedures and validate financial forecasts.
- Startup Founders: Understand the valuation methods applied to established companies like Sugi Holdings.
- Consultants: Produce comprehensive valuation reports for your clients.
- Students and Educators: Apply real data to practice and instruct on valuation techniques.
Contents of the Template
- Operating and Balance Sheet Data: Pre-filled historical data and forecasts for Sugi Holdings Co., Ltd. (7649T), including revenue, EBITDA, EBIT, and capital expenditures.
- WACC Calculation: A dedicated sheet for calculating the Weighted Average Cost of Capital (WACC), featuring parameters such as Beta, risk-free rate, and share price.
- DCF Valuation (Unlevered and Levered): Customizable Discounted Cash Flow models that display intrinsic value with comprehensive calculations.
- Financial Statements: Pre-loaded annual and quarterly financial statements to facilitate thorough analysis.
- Key Ratios: A collection of profitability, leverage, and efficiency ratios specifically for Sugi Holdings Co., Ltd. (7649T).
- Dashboard and Charts: Visual representations of valuation outputs and key assumptions, designed for easy analysis of results.
Disclaimer
All information, articles, and product details provided on this website are for general informational and educational purposes only. We do not claim any ownership over, nor do we intend to infringe upon, any trademarks, copyrights, logos, brand names, or other intellectual property mentioned or depicted on this site. Such intellectual property remains the property of its respective owners, and any references here are made solely for identification or informational purposes, without implying any affiliation, endorsement, or partnership.
We make no representations or warranties, express or implied, regarding the accuracy, completeness, or suitability of any content or products presented. Nothing on this website should be construed as legal, tax, investment, financial, medical, or other professional advice. In addition, no part of this site—including articles or product references—constitutes a solicitation, recommendation, endorsement, advertisement, or offer to buy or sell any securities, franchises, or other financial instruments, particularly in jurisdictions where such activity would be unlawful.
All content is of a general nature and may not address the specific circumstances of any individual or entity. It is not a substitute for professional advice or services. Any actions you take based on the information provided here are strictly at your own risk. You accept full responsibility for any decisions or outcomes arising from your use of this website and agree to release us from any liability in connection with your use of, or reliance upon, the content or products found herein.