
|
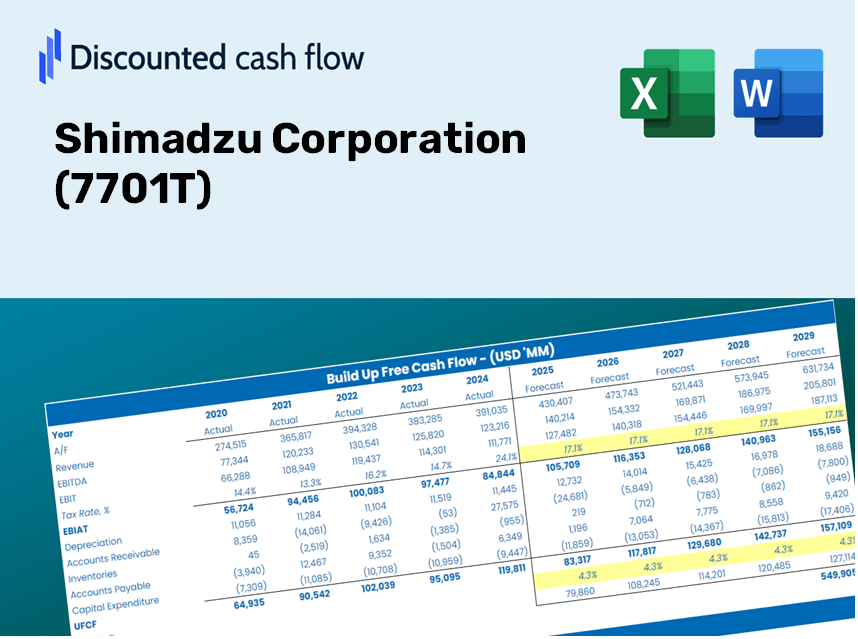
Shimadzu Corporation (7701.T) DCF -Bewertung |
Fully Editable: Tailor To Your Needs In Excel Or Sheets
Professional Design: Trusted, Industry-Standard Templates
Investor-Approved Valuation Models
MAC/PC Compatible, Fully Unlocked
No Expertise Is Needed; Easy To Follow
Shimadzu Corporation (7701.T) Bundle
Möchten Sie den inneren Wert der Shimadzu Corporation bewerten? Unser (7701T) DCF -Taschenrechner integriert tatsächliche Daten in umfangreiche Anpassungsfunktionen, sodass Sie Prognosen anpassen und Ihre Investitionsauswahl verbessern können.
What You Will Receive
- Adjustable Forecast Inputs: Effortlessly modify assumptions (growth %, margins, WACC) to explore various scenarios.
- Actual Financial Data: Shimadzu Corporation's (7701T) financial information pre-loaded to enhance your analysis.
- Instant DCF Outputs: The template automatically computes Net Present Value (NPV) and intrinsic value for you.
- Tailorable and Professional: A refined Excel model that aligns with your valuation requirements.
- Designed for Analysts and Investors: Perfect for evaluating projections, confirming strategies, and optimizing efficiency.
Key Features
- Comprehensive DCF Calculator: Offers detailed unlevered and levered DCF valuation models for thorough analysis.
- WACC Calculator: Ready-to-use Weighted Average Cost of Capital sheet with adjustable inputs.
- Customizable Forecast Assumptions: Easily modify growth rates, capital expenditures, and discount rates.
- Integrated Financial Ratios: Assess profitability, leverage, and efficiency ratios specifically for Shimadzu Corporation (7701T).
- Interactive Dashboard and Charts: Visual presentations of key valuation metrics for streamlined analysis.
How It Works
- Step 1: Download the Excel file.
- Step 2: Examine Shimadzu Corporation’s pre-filled financial data and projections.
- Step 3: Adjust key inputs such as revenue growth, WACC, and tax rates (highlighted cells).
- Step 4: Watch the DCF model refresh in real-time as you modify your assumptions.
- Step 5: Evaluate the outputs and leverage the results for informed investment decisions.
Why Opt for This Calculator?
- Precision Data: Accurate financial information from Shimadzu Corporation ([7701T]) ensures trustworthy valuation outputs.
- Tailorable: Modify essential parameters such as growth rates, WACC, and tax rates to align with your forecasts.
- Efficient: Ready-to-use calculations save you from beginning with a blank slate.
- Expert-Level Tool: Created for investors, analysts, and consultants focused on Shimadzu Corporation ([7701T]).
- Easy to Use: A user-friendly design and detailed instructions cater to users of all experience levels.
Who Should Use This Product?
- Professional Investors: Develop comprehensive and accurate valuation models for effective portfolio analysis of Shimadzu Corporation (7701T).
- Corporate Finance Teams: Evaluate valuation scenarios to inform strategic decisions within their organizations concerning Shimadzu Corporation (7701T).
- Consultants and Advisors: Deliver precise valuation insights to clients regarding Shimadzu Corporation (7701T).
- Students and Educators: Utilize real-world data to enhance financial modeling skills in the context of Shimadzu Corporation (7701T).
- Tech Enthusiasts: Gain insights into the market valuation of technology firms like Shimadzu Corporation (7701T).
What the Template Contains
- Pre-Filled DCF Model: Shimadzu Corporation’s financial data preloaded for immediate use.
- WACC Calculator: Comprehensive calculations for Weighted Average Cost of Capital.
- Financial Ratios: Assess Shimadzu's profitability, leverage, and efficiency metrics.
- Editable Inputs: Modify assumptions like growth rates, profit margins, and CAPEX to suit your scenarios.
- Financial Statements: Annual and quarterly reports for in-depth analysis.
- Interactive Dashboard: Effortlessly visualize essential valuation metrics and outcomes.
Disclaimer
All information, articles, and product details provided on this website are for general informational and educational purposes only. We do not claim any ownership over, nor do we intend to infringe upon, any trademarks, copyrights, logos, brand names, or other intellectual property mentioned or depicted on this site. Such intellectual property remains the property of its respective owners, and any references here are made solely for identification or informational purposes, without implying any affiliation, endorsement, or partnership.
We make no representations or warranties, express or implied, regarding the accuracy, completeness, or suitability of any content or products presented. Nothing on this website should be construed as legal, tax, investment, financial, medical, or other professional advice. In addition, no part of this site—including articles or product references—constitutes a solicitation, recommendation, endorsement, advertisement, or offer to buy or sell any securities, franchises, or other financial instruments, particularly in jurisdictions where such activity would be unlawful.
All content is of a general nature and may not address the specific circumstances of any individual or entity. It is not a substitute for professional advice or services. Any actions you take based on the information provided here are strictly at your own risk. You accept full responsibility for any decisions or outcomes arising from your use of this website and agree to release us from any liability in connection with your use of, or reliance upon, the content or products found herein.